This section includes the following topics:
- About Precise for SQL Server
- Components of Precise for SQL Server
- How Precise for SQL Server works
- What you can do with Precise for SQL Server
- Where to get more information
About Precise for SQL Server
Addressing the needs of DBAs, system administrators, managers, quality assurance specialists and planners, Precise for SQL Server provides a complete view of application performance by capturing, measuring, and correlating performance metrics from all critical system components.
Through its wide range of data presentations, Precise for SQL Server provides the tools necessary for proactive monitoring, diagnosing, detecting, and correcting of performance problems before they become visible in your SQL Server instances and related applications.
Current operational data is displayed to enable easy identification of problematic conditions. Recent operational data, pertaining to designated time periods, enables operations staff to detect problematic conditions that occurred in the past and that are likely to reoccur if not corrected. Performance data is archived and a fully detailed display of the historical data is provided for use in performance, QA and capacity planning analysis.
Precise for SQL Server's SmarTune engine provides information on performance findings that may indicate potential problems in the database. SmarTune displays a list of statements that may require tuning, a list of objects experiencing heavy activity or possessing an inefficient structure, and a list of instance events. Built in to the SmarTune engine, is a wealth of expert knowledge regarding possible areas of deterioration, and links that can guide you to the resolution of specific problems, that will enable you to optimize the performance of your system.
Improved performance management
IT staff frequently search for answers to questions like “Why did the application run so slowly last night?” or “Where is the application spending its time?”
Precise for SQL Server can help IT staff discover the answer to questions, such as, why an application ran so slowly during a particular time interval, or what resource is being used most of the time. The first step is to establish a baseline level of database resource consumption by understanding the behavior of the average application. The behavior of the average application represents the average percentage of the total time that all applications spend consuming or waiting for each resource. These aggregate figures provide a broad picture of the operation of your instance. They enable you to identify major bottlenecks in your system, for example, CPU and I/O limitations, SQL Server instance waits due to locks, remote queries, and so on.
Precise for SQL Server also enables you to focus on and drill down into individual applications, SQL statements and database objects in your system that are responsible for heavy consumption of system and database resources and to quickly find the definitive root cause of performance degradation.
Integration with other Precise products
Precise for SQL Server has been integrated with the following Precise products:
- Insight. Insight monitors the response times of systems and breaks these times down into the various Tiers and components. Insight also provides tier-specific metrics to help understand the activities in each tier. For more information, see the Precise Insight User Guide or Online Help.
- Insight SmartLink. Insight SmartLink pattern recognition engine correlates end-to-end activities and provides information on the application’s performance, from the user’s perspective. For more information, see the Precise Insight User Guide or Online Help.
- Alerts. Alerts provides a notification system that will alert you to application response time problems and enables you to launch Precise for SQL Server in context to view more detailed data. For more information, see the Precise Alerts User Guide or Online Help.
- Report Manager. Report Manager gathers and organizes historical information that enables the IT team to focus on infrastructure hot spots. Report Manager is a reporting tool that resides on a Web server. You can use Report Manager to compare period-to-period performance against a baseline and identify response time problems at-a-glance, before they affect your bottom-line. It queries the PMDB and displays the results in reports that are generated on a scheduled basis or on demand. For more information, see the Precise Report Manager User Guide or Online Help.
- Precise Custom Portal. The Precise Custom Portal is a lightweight, configurable portal application that provides access to various types of data from different applications. The Precise Custom Portal features a Web-based view. It is highly customizable and extensible, allowing you to build a dashboard for each user or each function within your organization. For example, you can build a dashboard for all the information that a system administrator or director of IT operations would need to constantly follow up on. This component is automatically installed as part of the Precise framework installation. For more information, see the Precise Custom Portal User Guide.
- Precise for SAP. Precise for SAP offers a wide range of data presentations that provides you with the information necessary to manage SAP client/server systems. Precise for SAP analyzes SAP system performance and applications and helps you to effectively direct resources and enhance system use. For more information, see the Precise for SAP User Guide or Online Help.
- Precise for Microsoft .NET. Precise for Microsoft® .NET, is a comprehensive performance management product for .NET applications that addresses the needs of system operators, managers, quality assurance specialists, and planners. It provides the specialized data collection and analysis capabilities demanded by the critical role of the .NET in application performance and scalability. For more information, see the Precise for Microsoft .NET User Guide or Online Help.
- PMDB. The PMDB is the repository of the Precise for SQL Server suite which stores application performance data for long-term analysis and trending reports. The data is collected by the Precise product suite. For more information, see the Precise Administration Guide or AdminPoint Online Help.
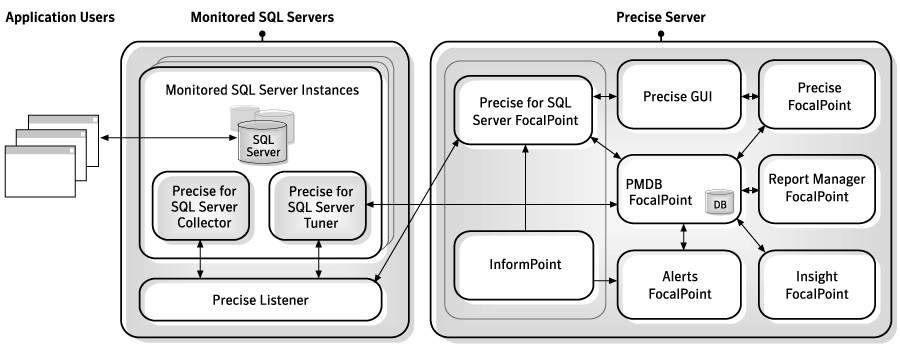
Components of Precise for SQL Server
Precise for SQL Server employs a web-based architecture to provide high performance database monitoring and tuning. Precise for SQL Server consists of the following components:
- One or more Precise for SQL Server Collectors installed on one or more servers in your application.
- Precise for SQL Server FocalPoint
- PMDB
- Collector extension, such as storage Collector or ERP Collector.
For more information, see the relevant product manual.
The following figure illustrates the typical architecture of a Precise for SQL Server installation.
Figure 1 Precise for SQL Server architecture
Precise for SQL Server agents
The Precise for SQL Server Collectors are installed on servers and communicate using TCP/IP. The Collectors collect and analyze SQL Server instance performance data, which is then stored in flat historical files and later in the PMDB.
The Collectors monitor and record all SQL Server database activity on a 24 x 7 basis. The Collectors work using a sampling technique and thereby consume less resources than a trace agent.
The Collectors collect resource consumption data on the following SQL Server data entities: databases, sessions, programs, statements, batches, login names, DB users, machines, SQL Server jobs and steps.
The following agents are available:
- Application Performance agent. Precise for SQL Server provides a complete view of application performance management by capturing, measuring and correlating performance metrics from all critical system components.
- SAP, PeopleSoft and Siebel Collectors. If ERP support is installed, the Collector also includes the Interpoint for PeopleSoft, SAP or Siebel agents. This agent provides data on the activities and resource consumption of packaged application entities. This data can help you identify ERP users, transactions, reports, and so on, that are heavy users of SQL Server resources. The current version only supports SAP, PeopleSoft, and Siebel Collectors.
- COM+ Collector. If COM+ support is installed, the COM+ Collector provides data on COM+ applications that originate in SQL Server activity. It can help you correlate your SQL Server instance and COM+ activity.
- Storage agents. EMC Storage, HP Storage, Hitachi Storage, and Storage for Windows. See Storage systems.
Precise Listener and Precise for SQL Server FocalPoint
Each Precise product has a FocalPoint that communicates with the listeners installed on the monitored servers. The Precise Listener communicates with other Precise components on the same server. For example, the PMDB FocalPoint requests to load data into the PMDB are sent to the Precise Listener. Then, the Precise Listener executes the PMDB loader to aggregate and prepare performance data to be loaded. In a similar way, InformPoints send requests to the Precise Listener.
PMDB Loaders
PMDB Loaders periodically load data, collected by the Collectors and stored in the historical files, into the PMDB. When the PMDB Loaders run, the flat historical files, written after the last time data was loaded into the PMDB, are identified and opened. The summarized data is also loaded into the PMDB. Data on the last incomplete time slice is only loaded into the PMDB when the next scheduled load process runs.
Storage systems
The storage systems supported by Precise for SQL Server include EMC Storage systems, HP storage systems, Hitachi storage, Storage for Windows, and other non-EMC storage systems:
- EMC, Hitachi, HP Storage systems, and Storage for Windows systems. The EMC Storage systems supported by Precise for SQL Server include Symmetrix® units and CLARiiON® units. In addition, Precise for SQL Server supports HP storage systems, Hitachi storage systems, and Storage for Windows. For those storage systems, I/O wait mapping extends into the storage units, which means that you can see how the disks in these storage units are actually allocated and used.
Precise for SQL Server displays information that relates the I/O wait to EMC Storage devices in which they are stored. This allows you to locate specific EMC Storage devices where performance problems are occurring.
By analyzing the information collected from your SQL Server instances, Precise for SQL Server provides an accurate picture of I/O activity and all the information needed to tune the I/O system. Using data collected by the EMC Storage agent, you can determine the cause of problems in your EMC Storage unit and optimize data distribution to reduce I/O wait time and maintain instance performance levels.
By identifying overactive EMC Storage devices, you can maintain performance levels by reorganizing storage configurations, reallocating your database objects to other file groups, or moving file groups to alternative devices. EMC Storage information can be viewed in the Activity and Objects tabs.
- Other storage systems. Other storage systems supported by Precise for SQL Server include storage systems that work with Microsoft SQL Server 2005 and later, running on Microsoft Windows 2000 and later servers. For these storage systems, I/O wait mapping does not extend into the storage units; it ends at the host data level.
For example, if you have a Network Appliance storage system installed, you can see the I/O wait on LUNs (Logical Unit Number), which are the physical disks in a Microsoft Windows operating system, but you cannot see how these disks are actually allocated and used.
How Precise for SQL Server works
Precise for SQL Server stores a complete history of your SQL Server instance activity in the PMDB. This provides you with a performance tracking tool that gives you the ability to assess SQL Server instance performance trends and analyze changes in SQL Server instance activities over long periods of time. This data is vital for identifying patterns in resource consumption and predicting future resource consumption in your SQL Server instance.
The Precise for SQL Server Collector runs on your server using a unique, accurate and comprehensive sampling technology, that requires low overhead. It collects performance data from an instance and then correlates and loads the data into the PMDB tables. This data is then analyzed and summarized by the FocalPoint. You can later access this data using the Precise for SQL Server Web browser interface.
The SmarTune process detects performance deterioration by regularly analyzing SQL Server performance data, and identifying less than optimal behavior.
What you can do with Precise for SQL Server
Use Precise for SQL Server to detect, diagnose and resolve performance problems in your SQL Server instance. Precise for SQL Server enables you to identify real-time performance problems (for example, locking problems) and monitor a complete history of your SQL Server instance.
You can use Precise for SQL Server to:
- Resolve performance problems by identifying their root cause and improving statement performance.
- Proactively monitor, analyze, and tune SQL Server instances.
- Analyze and tune locking problems.
- Determine whether an I/O problem is caused by a SQL Server application.
- Tune a database object rather than a specific statement that accesses the database object.
- Perform I/O tuning of storage devices.
- Identify the most resource-consuming SQL statement and view a detailed explanation of the execution plan of the SQL statement.
- Monitor your system's current state as well as previous states.
- Recommend which index would provide a better execution plan and reduce resource consumption. If you are running SQL Server 2005 or later, you can also test and evaluate the cost of implementing statement tuning recommendations with the What-if option.
The What-If tab shows the number of statements whose performance would improve and the number of statements whose performance would deteriorate by implementing the recommendation. It also shows the cost of implementing the recommendation so that you can weigh the pros and cons of implementing the change. Use the What-If option to evaluate a set of recommendations on the workload containing the most common Transact-SQL statements used by the application, during the selected time frame.
Where to get more information
More information on Precise, its products, technical notes, and so on, can be found in the Release Notes document for this version.