This section includes the following topics:
- How Business Dashboard is structured
- About the Business Dashboard toolbar
- About the Application Structure Overview pane
- About the Application Status pane
- How the Configuration screen is structured
How Business Dashboard is structured
The Business Dashboard screen includes the following three areas:
- Business Dashboard toolbar
- Application Structure Overview pane
- Application Status pane
Figure 1 Precise Business Dashboard screen
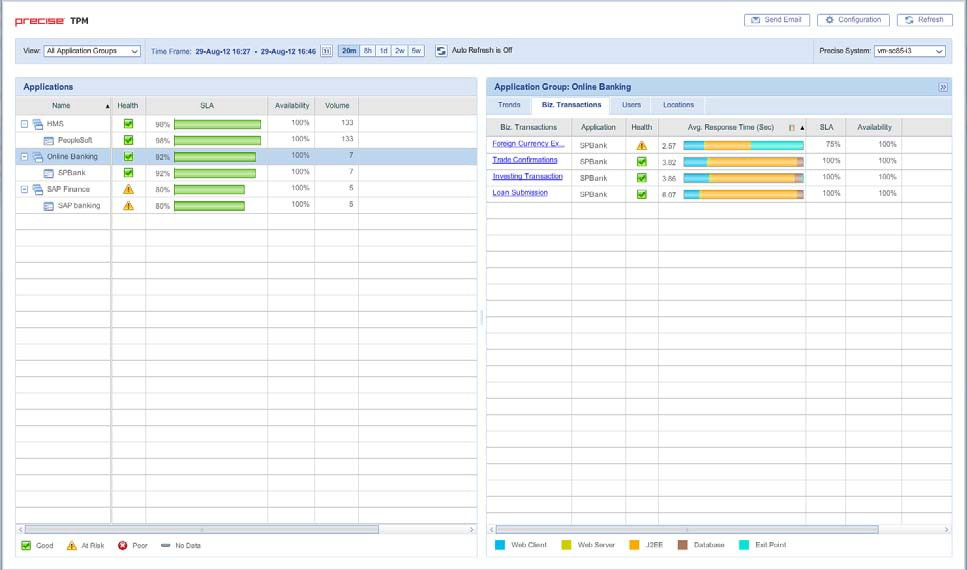
From the Business Dashboard toolbar (top), you select the Precise node (if there are multiple nodes installed), view, and time frame of the collected data displayed in the left and right panes below.
The Application Structure Overview pane (left) contains a tree view of all monitored application groups and applications, with their main metrics displayed in table format.
To configure your Application Structure and define its settings, see Configuring your application structure. Selecting an entity (application group or application) in the Application Structure Overview pane displays the associated information in the Application Status pane.
The Application Status pane (right) contains tabs displaying overtime graphs of the main metrics (Trends) or breakdowns of the logged activity by Biz. Transactions (Business Transactions), Users, and Locations for the selected application or application group.
About the Business Dashboard toolbar
The Business Dashboard toolbar enables you to select the Precise Node, View, Time Frame, and other control buttons.
The following table describes the function of each of the toolbar elements.
Table 1 TPM toolbar elements
| Item | Name | Description |
|---|---|---|
 | Send E-mail | Sends an email message with a link to view the appropriate data. |
 | Configuration | Opens the Configuration screen to view, add, or edit current configurations. |
 | Refresh | Manually updates the data currently displayed for the defined time frame. |
 | View | Allows you to select a specific view, displaying information for a subset of all monitored application groups. The drop-down menu contains the following view options:
|
 | Time Frame | Allows you to select the desired time range for the displayed data. The time frame options include the option to define a customizable option using the calendar icon, in addition to the following predefined options:
|
 | Auto Refresh | Turns Auto Refresh On/Off. Offering the same functionality as the manual Refresh button, but enables you to configure the system to automatically refresh the information displayed or not. |
 | Node | The Node field shows you which Precise node is currently displayed. The Node field is only displayed when more than one Precise node is installed, and only on Precise applications with the TPM version 8.8 patch installed. |
 | Expand | Expands the Application Structure Overview pane, and hide the Application Status pane. |
 | Collapse | Collapses the Application Structure Overview pane, and unhide the Application Status pane. |
The Node menu allows you to choose one of several installed Precise nodes for monitoring.
The Node field is only displayed when more than one Precise node is installed.
To select a Precise node from the Node field
- Click the arrow on the right of the field to display all available Precise nodes.
- Click to select one of the displayed nodes.
- Click OK.
Selecting the Business Dashboard view
You can define Business Dashboard to display all monitored application groups or a subset of application groups in the Application Group Overview pane.
To define the Application Structure Overview pane view
- Click the arrow on the right of the View field to display all application group types.
- Click to select one of the following view options:
- Critical Application Groups
- Application Groups with Poor Health
- All Application Groups (default)
Selecting a time frame
You can configure Business Dashboard to display transaction performance data for a specific time frame using the predefined time frame or calendar icons.
Selecting a predefined time frame from the toolbar displays transaction performance data for the selected time period up to the current time. See Selecting a predefined time frame from the TPM toolbar.
Selecting the time frame using the calendar icon, you can choose to define a time range independent of the current time, or to define a time range up to the current time. See Configuring the time frame using the calendar icon.
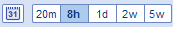
The predefined time frame options are:
- Last 20 minutes (20m)
- Last 8 hours (8h) (default)
- Last day (1d)
- Last 2 days (2d)
- Last 2 weeks (2w)
- Last 5 weeks (5w)
The time frame selected affects the information that is displayed in both panes on the Business Dashboard screen. Only data that falls within the selected time frame is shown in these areas.
Selecting a predefined time frame from the TPM toolbar
To select a predefined time frame
- From the TPM toolbar, select one of the predefined time frames.
Configuring the time frame using the calendar icon
To configure the time frame
- Click the Calendar icon. In the dialog box that is displayed:
- Select the ‘Time Range’ option and select the Start and End dates and times.
OR - Select the ‘Last’ option and enter the desired time frame.
- Select the ‘Time Range’ option and select the Start and End dates and times.
- Click OK.
Sending an email message
You can send an email message to one or more recipients from the Business Dashboard toolbar.
The default subject for the message will be “Precise Business Dashboard”.
The email will include a link to the Business Dashboard view in the current context (time frame and selected entries).
To send an email message
- Click Send Email on the Business Dashboard toolbar. The default email program opens.
- Fill in the required fields and click Send.
Refreshing the Business Dashboard screen
Using the Business Dashboard or Configuration screen, you can both manually refresh the information displayed on the Business Dashboard screen and configure Business Dashboard to automatically refresh the information every five minutes.
To manually refresh the Business Dashboard screen for the selected time frame
- Click Refresh on the Business Dashboard toolbar.
To configure Business Dashboard to automatically refresh the information for the selected time frame every five minutes
- On the Business Dashboard toolbar, click Auto Refresh is Off. The icon will then say Auto Refresh is On.
OR - In the Display tab in the Configuration screen, check mark the “Auto Refresh” box.
Opening the Configuration screen
The Configuration screen displays a number of tabs based on what you want to configure.
To open the configuration screen
- Click Configuration on the Business Dashboard screen to open the configuration screen.
About the Application Structure Overview pane
The Application Structure Overview pane (left) displays information in table format for all application groups and applications.
The information displayed for SLA and Volume in this pane is solely based on transactions marked as key transactions for SLA and/or Volume. For details about key transactions, see About the application structure.
The data in all the table columns can be sorted in ascending or descending order. In addition, the column width and order can be adjusted by dragging and dropping the column heading to the desired location.
The table in the Application Structure Overview pane displays the following information:
- Name. The applications, displayed within their application groups.
- Health. The Health status icons ("Good", "At Risk", "Poor" or "No Data") represent the health status of an application or application group. The Health status is first calculated based on the combined percentage of SLA compliance and Availability according to a user defined ratio. The Health status icon is then based on user defined thresholds. These ranges are set in the Health tab on the Configuration screen.
- SLA. The SLA compliance rate, indicating the percentage of executions of key transactions for SLA that met the defined SLA thresholds
- Volume. The total number of executions of key transactions for volume.
Value ($). The total dollar value of the application or application group, based on the sum of the number of executions of each transaction within the application or application group multiplied by its defined dollar value per execution.
When there is no Value ($) available, the Value ($) column will not appear.
- Availability (%). The total percent of successful page invocations.
The information provided in the Application Structure Overview pane can be sorted by any of the displayed columns. To sort information, click on the desired column header. A black arrow will appear at the right of the column header indicating if the information is shown in ascending or descending order. In addition, the order of the columns on the table can be changed by dragging and dropping the desired column header.
About Application Groups
You can configure the application structure to include multiple applications and create custom application groups as desired.
The names of the application groups are displayed in the Name column.
Table 2 Types of Applications
| Item | Name | Description |
|---|---|---|
 | Application Group name | Indicates an application group. |
 | Application name | Indicates a single application. |
For more about the application structure, see About the application structure.
To configure the application structure, see Configuring your application structure.
About the Application Status pane
The Application Status pane (right) contains four tabs that display the associated data for the application or application group selected in the left pane. The name of the selected application or application group appears at the top of the right pane.
After selecting an application or application group in the left pane, select the appropriate tab in the right pane to view information.
The tabs are:
- Trends (default)
- Biz. Transactions (Business Transaction)
- Users
- Locations
To analyze a selected biz. transaction, user, or location, click on its link in the corresponding tab. See Analyzing transaction performance.
The information provided in the Biz.Transactions, Users and Locations tabs can be sorted by any of the displayed columns. To sort information, click on the desired column header. A black arrow will appear at the right of the column header indicating if the information is shown in ascending or descending order. In addition, the order of the columns on the table can be changed by dragging and dropping the desired column header.
Analyzing transaction performance
Transaction performance is analyzed by launching Insight SmartLink (if configured) or Precise for Web for a selected business transaction, user or location. When SmartLink is configured, the Transactions view is launched. When SmartLink for PeopleSoft is configured, the Web Expert view is launched.
Drilling down from a PeopleSoft application will always launch Precise for Web.
To analyze transaction performance
- Click on an application group or application in the Application Structure Overview pane. The Trends tab in the right pane will display overtime graphs for the selected application group or application.
- In the Application Status pane, select a tab to view the selected application or application group broken down according to biz. transaction, user, or location.
- Select a biz. transaction, user, or location to launch SmartLink or Precise for Web in context.
About Trends
The Trends tab displays individual over time graphs for: SLA (%), Volume, and Value ($) for the application or application group selected in the Applications Structure Overview pane.
About the Biz. Transactions tab
The Biz. Transaction tab contains a table displaying the following information for each business transaction in the application or application group selected in the Application Structure Overview pane:
- Biz. Transaction name. The unique name of the biz. transaction. Active links in this column indicate the option for in-depth analysis. If SmartLink is configured the analysis will be done in the Transaction view, otherwise it will be done in the Web Expert view. The ToolTip displayed when hovering over the hyperlink indicates to where the link is launching (Precise for Web, Precise SmartLink).
- Application. If an application group is selected in the Applications Structure Overview pane, this column appears, displaying the specific application that the information in that row reflects.
- Health. The Health status icons ("Good", "At Risk", "Poor" or "No Data") represent the health status of an application or application group. The Health status is first calculated based on the combined percentage of SLA compliance and availability according to a user defined ratio. The Health status icon is then based on user defined thresholds. These ranges are set in the Health tab on the Configuration screen.
Avg. Response Time (Sec). The average response time for the biz. transaction, displayed in seconds. Next to the value in seconds, this column displays a color coded breakdown bar. This bar represents the relative average response time of each technology as a percentage of the total. The value per technology represents all AppTiers and instances for that technology.
Information displayed in this column can be displayed in two modes, depending on what information is important to the user. The fixed (default) mode displays the breakdown bar in full size for each biz. transaction. In this mode you can clearly see the relative response time breakdown per technology for each biz. transaction. The second mode displays a normalized view of the breakdown bar for each biz. transaction in relative size to the biz. transaction with the highest average response time. In this mode, you can see the actual response time breakdown per technology (in seconds) for each biz. transaction.
- SLA (%). The SLA compliance rate, indicating the percentage of executions of key transactions for SLA that met the defined SLA thresholds.
- Volume. The total number of executions of key transactions for volume for the biz. transaction.
- Availability (%). The total percent of successful page invocations.
About the Users tab
The Users tab contains a table displaying the following information for each user registered in the application or application group selected in the Applications Structure Overview pane:
- Users. The unique name for the user. Active links in this column indicate the option for in-depth analysis. If SmartLink is configured the analysis will be done in the SmartLink UI, otherwise it will be done in the Precise for Web UI.
- Application. If an application group is selected in the Applications Structure Overview pane, this column appears, displaying the specific application that the information in that row reflects.
- Avg. Response Time (Sec). The average response time for the user, displayed in seconds. Next to the value in seconds, this column displays a color coded breakdown bar. This bar represents the relative average response time of each technology as a percentage of the total. The value per technology represents all AppTiers and instances for that technology. The length of the bar represents the overall average response time.
- SLA (%). The SLA compliance rate, indicating the percentage of executions of key transactions for SLA that met the defined SLA thresholds
- Volume. The total number of executions of key transactions for volume by the user.
- Availability (%). The total percent of successful page invocations.
- Health. The Health status icons ("Good", "At Risk", "Poor" or "No Data") represent the health status of an application or application group. The Health status is first calculated based on the combined percentage of SLA compliance and availability according to a user defined ratio. The Health status icon is then based on user defined thresholds. These ranges are set in the Health tab on the Configuration screen.
About the Locations tab
Having previously defined locations, you can logically divide the organization into geographic or organization groups. This helps you isolate local performance problems. The location definitions are based on the IP addresses of client machines.
The Locations tab contains a table displaying the following information for each location in the application or application group selected in the Applications Structure Overview pane:
- Locations. The name of the geographic location or organization group. Active links in this column indicate the option for in-depth analysis. If SmartLink is configured the analysis will be done in the Transaction view, otherwise it will be done in the Web Expert view.
- Application. If an application group is selected in the Applications Structure Overview pane, this column appears, displaying the specific application that the information in that row reflects.
- Avg. Response Time (Sec). The average response time for the location, displayed in seconds. Next to the value in seconds, this column displays a color coded breakdown bar. This bar represents the relative average response time of each technology as a percentage of the total. The value per technology represents all AppTiers and instances for that technology. The length of the bar represents the overall average response time.
- SLA (%). The SLA compliance rate, indicating the percentage of executions of key transactions for SLA that met the defined SLA thresholds
- Volume. The total number of executions of key transactions for volume from this location.
- Availability (%). The total percent of successful page invocations.
- Health. The Health status icons ("Good", "At Risk", "Poor" or "No Data") represent the health status of an application or application group. The Health status is first calculated based on the combined percentage of SLA compliance and availability according to a user defined ratio. The Health status icon is then based on user defined thresholds. These ranges are set in the Health tab on the Configuration screen.
How the Configuration screen is structured
The Configuration screen enables you to define what information is displayed on the Business Dashboard screen. There are three tabs on the Configuration screen:
- Hierarchy (default)
- Health
- Display
Only users with Precise manager permissions will see all three tabs. Users with Precise monitor permissions will only see the Display tab.
From the Hierarchy tab, you can view, add, edit, or delete an application group, single application, or biz. transaction. From the Health tab, you can configure the formula that defines the health levels of applications, application groups, and biz. transactions.
From the Display tab, you can enable/disable the Auto Refresh function and define the information collection settings. The following table describes the functions of the Configuration screen elements.
Table 3 Configuration screen elements
| Item | Name | Description |
|---|---|---|
 | Business Dashboard | Click to open the Business Dashboard screen. |
| Node | The Node field shows you which Precise node is currently displayed. The Node field is only displayed when more than one Precise node is installed, and only on Precise applications with the TPM version 8.8 patch installed. The Node field will never be displayed in the Health tab as the Health settings are global. |
 | Add Application Group | In the Hierarchy tab, click this button to add a new application group. |
| Add Biz. Transaction | In the Hierarchy tab, click this button to add a new biz. transaction. |
To filter the available applications, biz. transactions, users or locations, enter a name into the Filter field and click Filter.
About the Hierarchy tab
In the Hierarchy tab you can view and configure the application structure and define which transaction must be represented on the Business Dashboard screen.
In the left pane of the Hierarchy tab there is a tree view of your application structure hierarchy, showing:
- Application Groups
- Applications
- Biz. Transactions.
Table 4 Types of icons displayed in the left pane of the Hierarchy tab
| Item | Name | Description |
|---|---|---|
| Application Group | Indicates application groups. |
| Application | Indicates a single application. |
| Biz. Transaction | Indicates a biz. transaction. |
For more details about the application structure, see About the application structure.
From this pane, you can select a row and left-click to edit or delete an application group, single application, or biz. transaction.
For an application group, you can choose to:
- Add an application group
- Edit
- Delete
- Designate and mark an application group to be critical. See Scenario # 1 - Adding a new application group, Scenario # 2 - Editing an application group, and Scenario # 3 - Deleting an application group.
For a biz. transaction, you can choose to:
- Add biz. transaction
- Edit
- Delete
See Scenario # 4 - Adding a new biz. transaction, Scenario # 5 - Editing biz. transactions, and Scenario # 6 - Configuring key transactions.
About the Health tab
In the Health tab, you can view and configure the health status definitions for the application structure.
The health status icons ("Good", "At Risk", "Poor" or "No Data") represent the health status of an application or application group. The health status is first calculated based on the combined percentage of SLA compliance and availability according to a user defined ratio. The health status icon is then based on user defined thresholds.
See Scenario # 9 - Customizing the Health status.
About the Display tab
In the Display tab, you can define the information collection settings:
- Enable/disable the Auto Refresh function.