The IDERA SQL Inventory Manager Explorer tab lets you explore the instances and databases of your environment. You can choose different views and filters in order to learn more about the data and activity of your SQL Servers instances.
The following is an example of the many options for exploring the information on your environment:
- You can select to show data size by instance/database tags to see which of your tags contain the most data.
- Then, you can select a tag name to get more specific information.
- Finally, you can access the tagged instances to get a view of your data size by instances/databases and filtered with the respective tag.
Like this example, you have many different options to select the information you want to see from your environment. By using tags, owners, and locations from your SQL Servers instances, you get significant advantages from this section.
Choosing the information you want to see
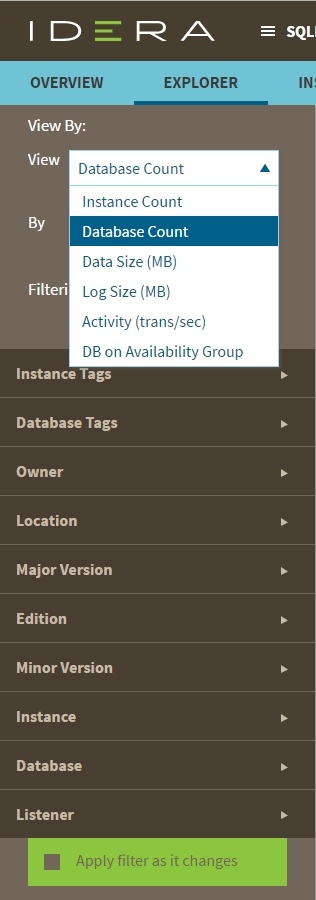
The View Selection section allows you to choose what specific information or under which main parameter you want IDERA SQL Inventory Manager to display the information.
You can select to View the following type of information:
- Instance count
- Database count
- Data size (MB)
- Log size (MB)
- Activity (transactions per second)
- Database on Availability Group
Understanding the Databases on Availability Group view
IDERA SQL Inventory Manager allows you to explore by Databases on Availability Group. Depending on need, you can monitor any member of the AlwaysOn Availability Group and IDERA SQL Inventory Manager displays information about the primary node, secondary nodes, and databases that are in the AlwaysOn Availability Group including:
- Database Name
- Listener
- Primary Node
- Secondary Node
- Owner
If you not only want to receive static information about AlwaysOn Availability Group databases but also want to monitor health checks of all nodes or track statuses of databases that are not in the AlwaysOn Availability Group, you must add all of the nodes in which you are interested. Because the listener is simply a virtual network name that points to physical instance in a primary or secondary replica of an AlwaysOn Availability Group, you are responsible for the correct AlwaysOn Availability Group configuration.
Additional options
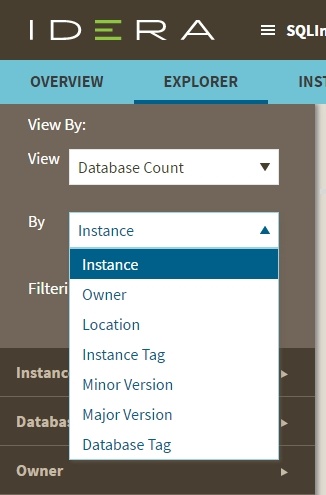
Then you choose to see the previous selected information delimited By the following options:
- Instance
- Instance tag
- Owner
- Location
- Minor server version
- Major server version
- Edition
- Database (Type the name of the database. This field accepts wildcards.)
- Database tag
- Listener (Database and Listener filters allow you to filter for specific items when you are trying to get a list of databases on availability groups.)
As a result, you may be able to see information such as database count by instance, instance count by location, data size by owner, and other interesting information from your environment. Take into account that some options may only be available depending of what you choose in the View and By fields.
You can enable the option Applying filter as it changes to have immediate information, or you can disable this option when you want to make your selections first and see the requested information after you finish.
Using filters to refine what information you see
After you choose what data you want to see and by which parameter, you can also optionally select from the group of filters to narrow your search criteria. This section contains the following options:
Instance Tags
This option allows you to determine a specific instance tag or tags for your selection. When you click the drop down menu of this section, you can sort the list of tags by name or count, and then choose the tag or tags that you want to include in your selection.
To access to the complete list of tags, click more. If you want to remove your selections, click Remove tag filters.
Database Tags
This option allows you to determine a specific database tag or tags for your selection. When you click the drop down menu of this section, you can sort the list of tags by name or count, and then choose the tag or tags that you want to include in your selection.
To access to the complete list of tags, click more. If you want to remove your selections, click Remove tag filters.
Owner
This option allows you to determine a specific owner or owners for your selection. When you click the drop down menu of this section, you can see a list of all your environment's owners. Choose the owner or owners that you want to include in your selection.
To access to the complete list of owners, click more. If you want to remove your selections, click Remove owner filters.
Location
This option allows you to determine a specific location or locations for your selection. When you click the drop down menu of this section, you can see a list of all your environment's locations. Choose the location or locations that you want to include in your selection.
To access to the complete list of locations, click more. If you want to remove your selections, click Remove location filters.
Instance
This option allows you to determine a specific instance or instances for your selection. When you click the drop down menu of this section, you can see a list of your registered instances. Choose the instance or instances that you want to include in your selection.
To access to the complete list of instances, click more. If you want to remove your selections, click Remove instance filters.
Version
This option allows you to determine a specific version or versions for your selection. When you click the drop down menu of this section, you can see the list of all available versions, choose the version or versions that you want to include in your selection.
To access to the complete list of versions, click more. If you want to remove your selections, click Remove version filters. On the top section of the filtering options, click Clear to quickly remove all your chosen filters and select new ones.
As you filter your information, the options you select appear on the top section of your graphs. You can uncheck from this section to individually remove filters.
Viewing filtered information
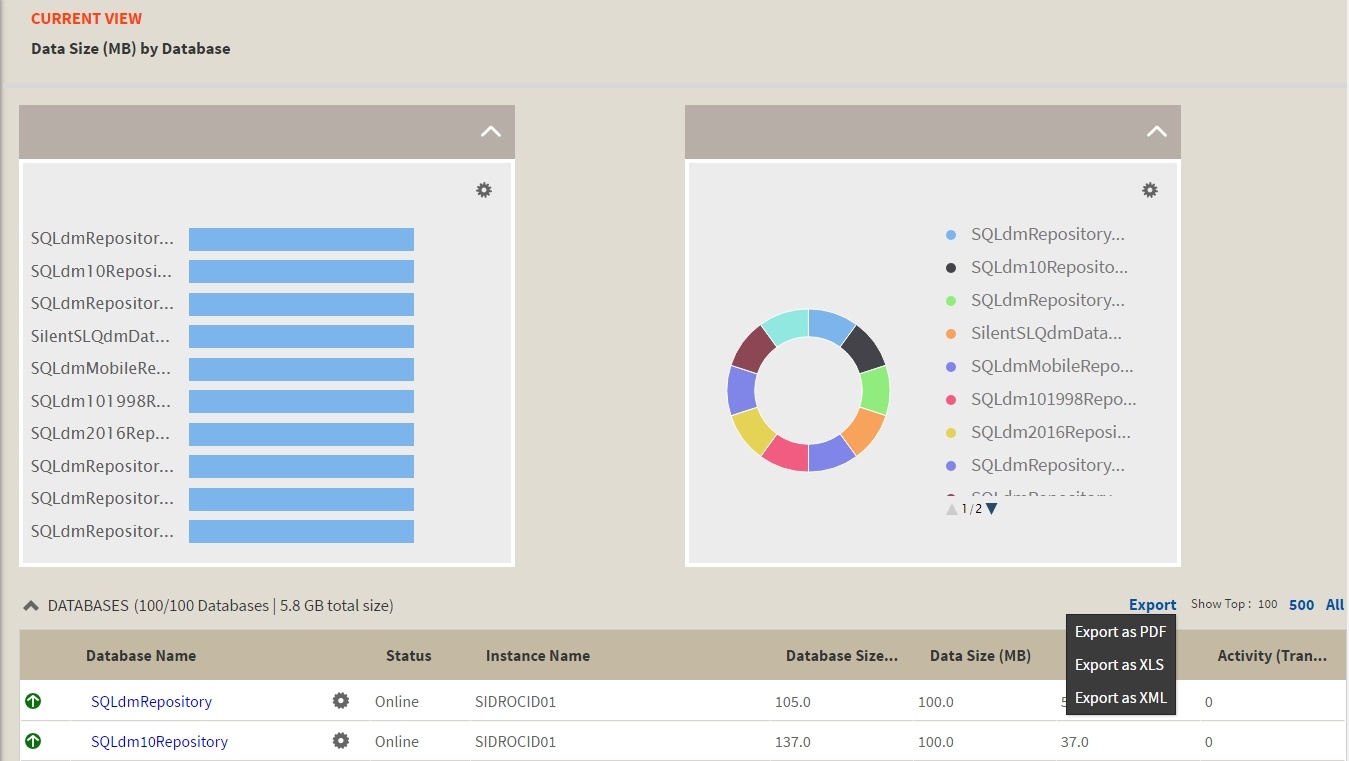
After you specify the filters you need, IDERA SQL Inventory Manager displays graphs to provide a visual representation of the data you have selected. The bar and pie graphs let you quickly get a glance of your environment according to your parameters.
You can also choose how many instances IDERA SQL Inventory Manager will display on your graphs by selecting the top 100, 500, or All instances. This option is located at the bottom right side of your graphs.
Below these graphs, IDERA SQL Inventory Manager shows you a table of the information that corresponds to your selection.
You can click a database or instance name to access its respective details. For more information on what is available on these views, refer to Viewing Database Details or Viewing instance details respectively.
Saving your filtering criteria
Creating a useful filter to "weed out" unnecessary information takes time but is important when managing large environments. As a result, you may want to save that filter for future use. IDERA SQL Inventory Manager allows you to save filters for use in the Explorer and Instances views. Simply create the filter, and then click Save as Explorer favorite or click Save as Instances favorite, depending on which view you are in when creating the filter. To use that filter, click Load Explorer favorite or click Load Instances favorite.
Drill-down options for locating more specific information
Drill down to view by instances
When you view high-level objects such as tags, owners, locations, or versions, you can drill down to see their respective instances by clicking the arrow icon next to the object you want to see more specific information.
Click  and IDERA SQL Inventory Manager changes your selection to View by Instances and filters it according to the tag, owner, location or version you selected before.
You can go back to your previous view by clicking  on the top left section of your instances table.
Drill down to view by databases
When you are viewing your information by instances, you can drill down one more level and view by databases.
Click next to the instance you want to see its respective databases, and IDERA SQL Inventory Manager displays the list of databases that belong to the respective instance. The view changes to View by Databases and filters it by the selected instance.
You can go back to the previous view by clicking on the top left section of your databases list.
Exporting Explorer view information
You can export the information available on the Explorer view, by clicking the Export option on the right-bottom side of your graphs and selecting your preferred format for Exporting: PDF, XLS, or XML.
You can set the number of instances you want IDERA SQL Inventory Manager to show per page, go to the bottom of the page, type the number you require, and then press Enter.
IDERA SQL Inventory Manager lets you discover and visualize your SQL Server environment. Learn more > >