The Side by Side Server Performance widget of My environment displays information about the combined resource utilization on servers hosting BI services. It contains the following statistics.
- Server name
- Status of the service
- CPU usage in percentage
- Memory usage in percentage
- I/O Read in Bytes/sec
- I/O Write in Bytes/sec
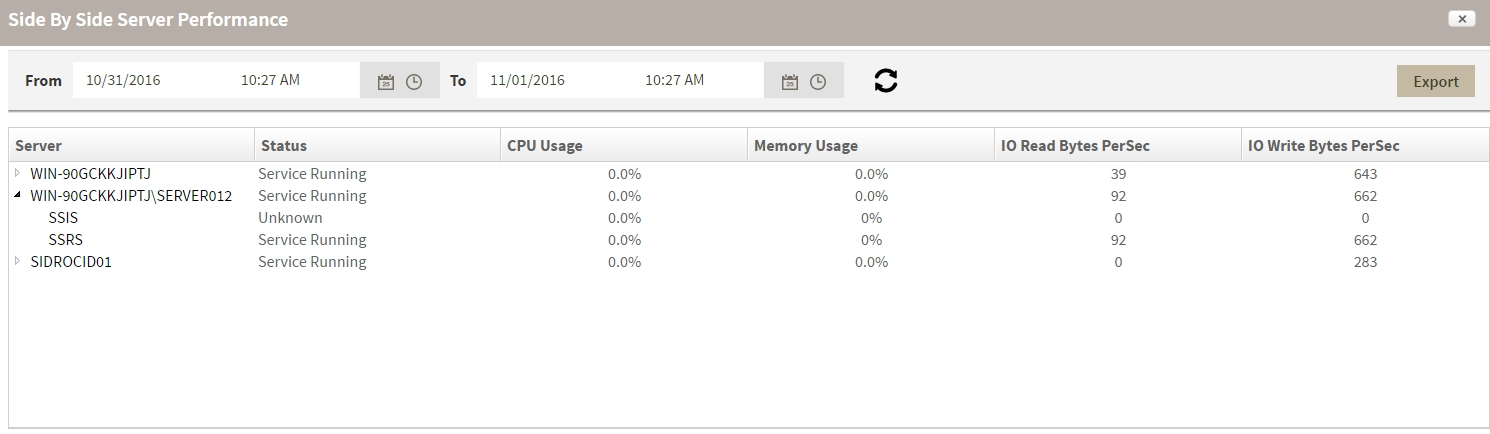
Additional options
Select a time interval: You can select a time interval for which you want information returned.
Export: You can export the information displayed to a PDF, XLS, or XML file.
Select SQL Server: You can select a server to expand the list and display similar information for all BI services running on that server.