The Resources tab allows you to monitor the system resources on the server hosting the Azure SQL instance.
Summary
The Resources Summary tab displays real-time charts allowing you to quickly identify key diagnostic statistics for monitoring the resources for the selected Azure SQL instance.

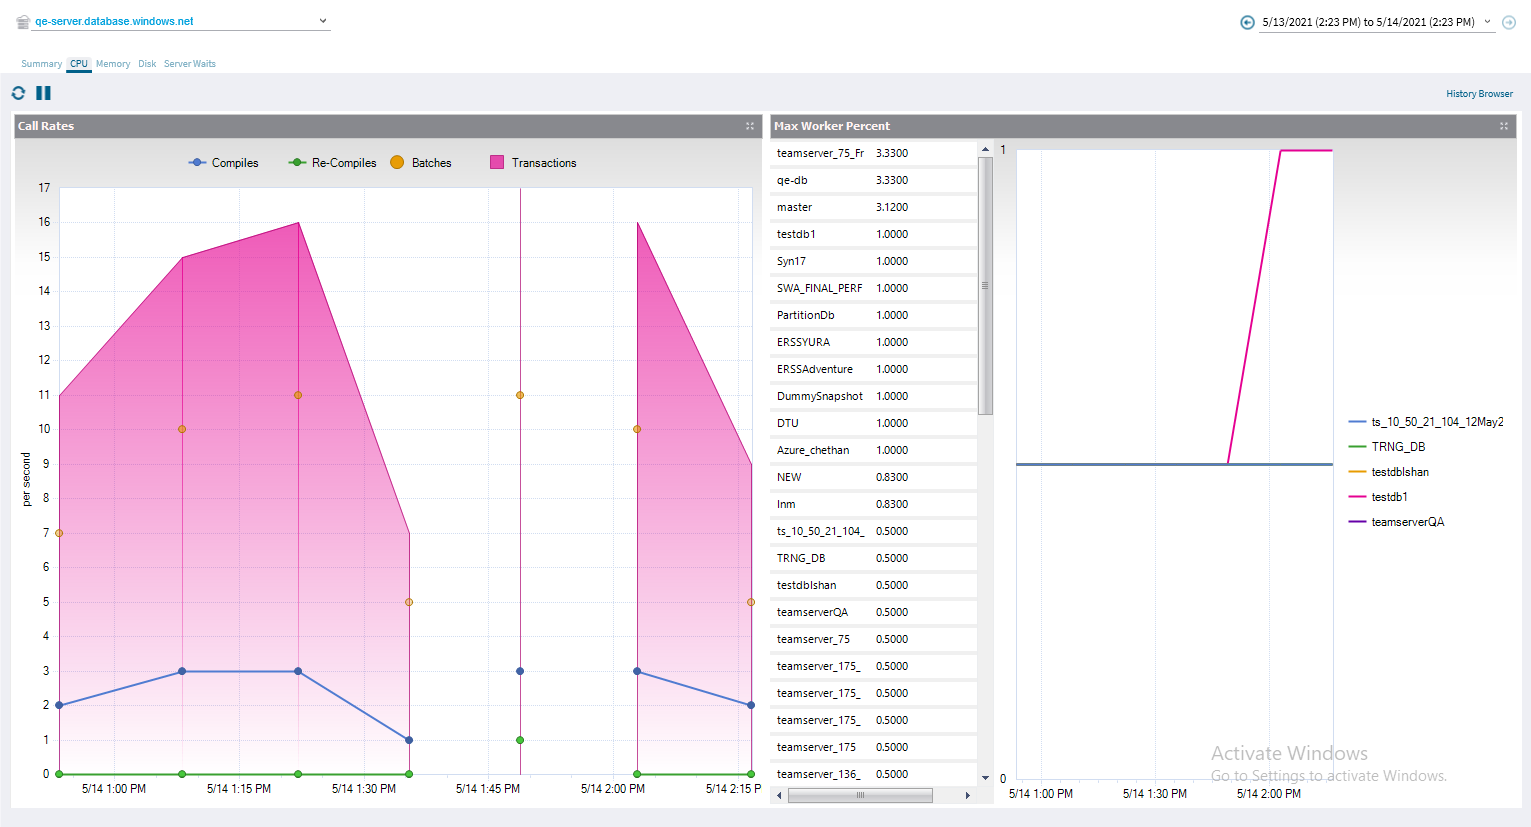
CPU
The Call Rates chart displays the rate of batch statements, the compiles into procedure cache, then recompile of statements stored in the procedure cache.
In addition, the Max Worker Percent chart shows the percentage of worker threads used on the database, relative to the maximum available for the service tier.
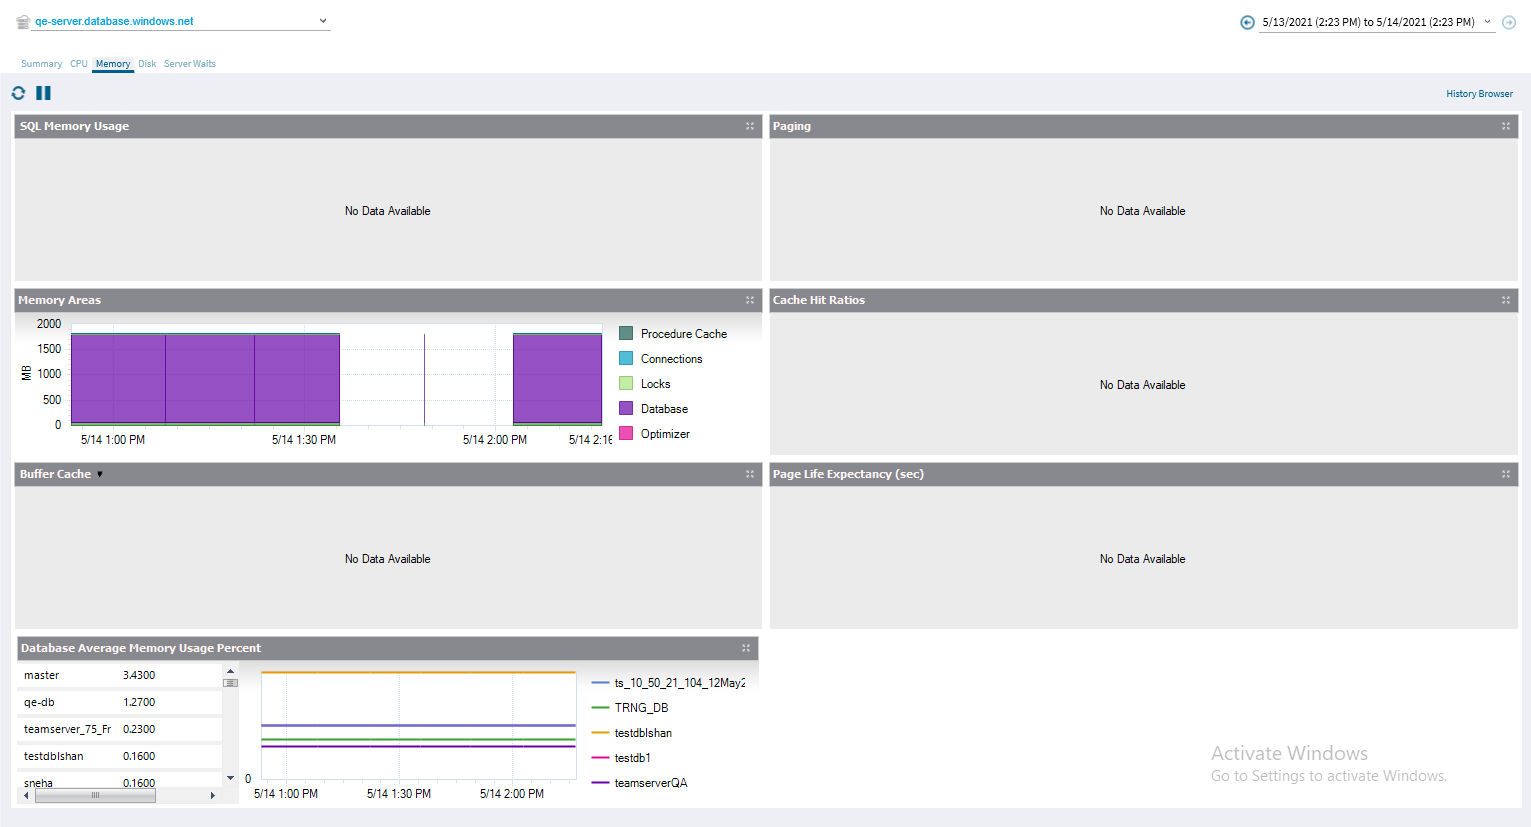
Memory
The following charts are available on the Memory tab:
- SQL Memory Usage - Displays the SQL Memory Usage by what is used by SQL Server compared to what is allocated and the total used.
- Paging - Displays the memory pages per second.
- Memory Areas - Displays the memory usage of the Procedure Cache, Connections, Locks, Database, Optimizer, Sort, Hash, and Index.
- Cache Hit Ratios - Displays the hit ratios of the Buffer and Procedure cache.
- Buffer Cache - Displays the buffer cache used by Free and Active pages.
- Page Life Expectancy (sec) - Provides the time in seconds that a page remains in the cache or buffer pool.
- Database Average Memory Usage Percent - Displays the percentage of memory used for the database, relative to the maximum available for the service tier.
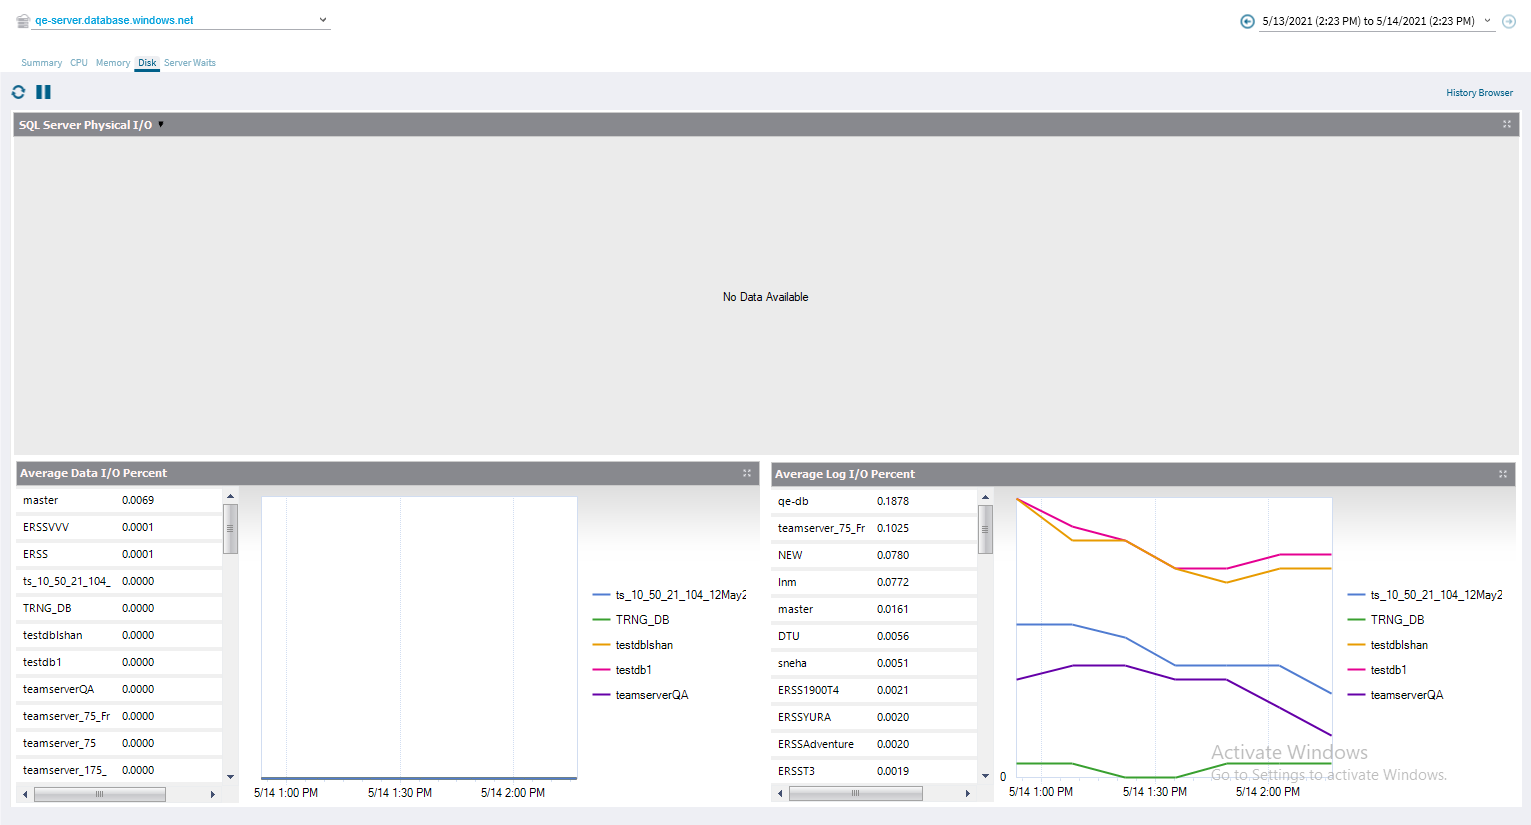
Disk
The Disk tab shows the key statistics on the way your disks are used on your Azure SQL server.
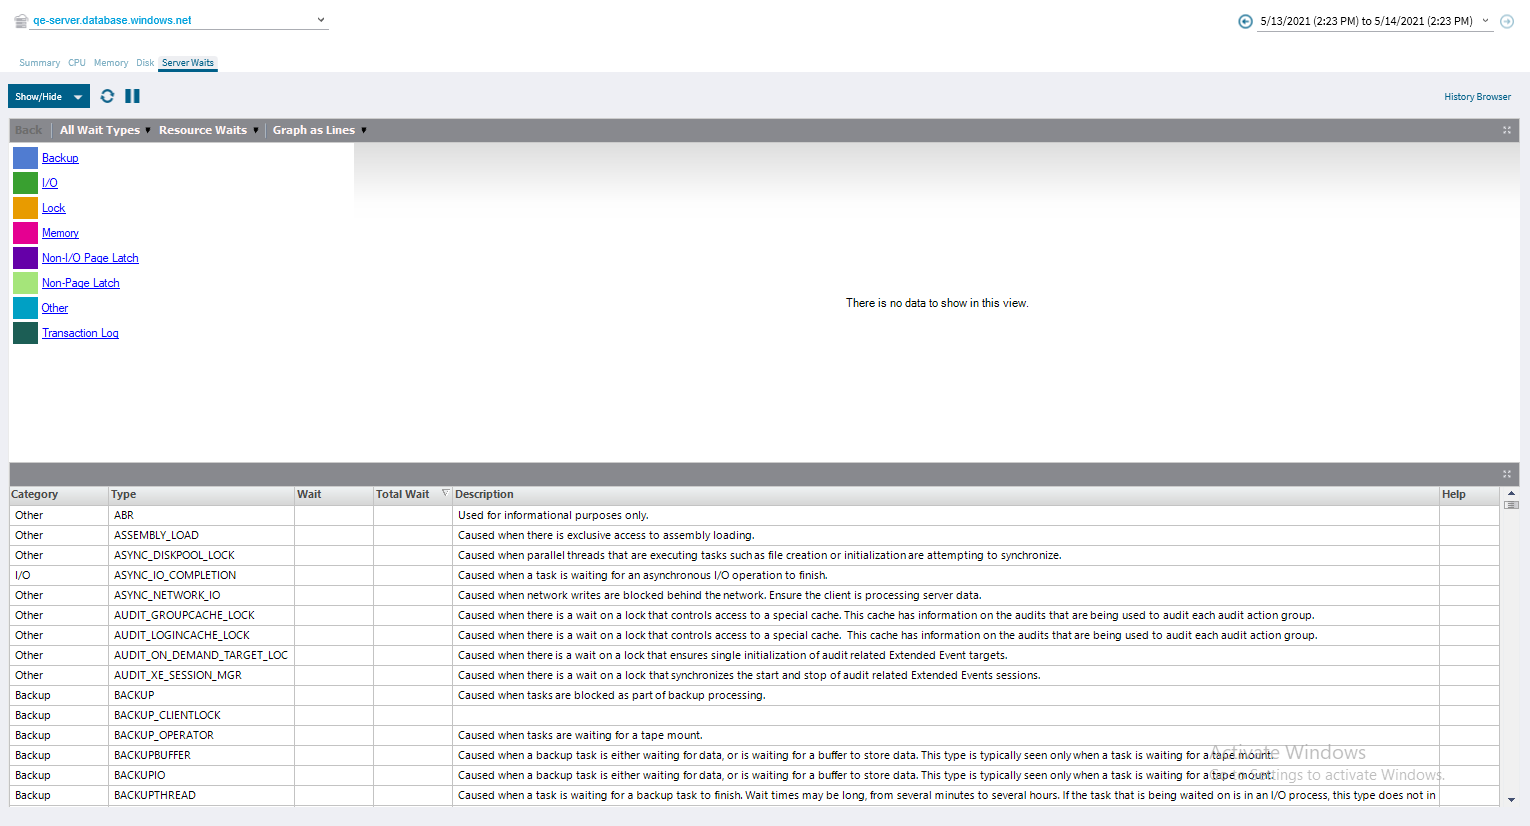
Server Waits
The Server Waits view allows you to see all of the waits affecting Azure SQL server performance.