On a number of views, SQL Diagnostic Manager includes filtering options ranging from ribbons allowing you to select items shown on the view, to a Filter Settings window that provides a variety of options to customize how SQL Diagnostic Manager presents your view.
Use the Filter options to customize your view
The Filter box contains the filtering options available for that view, meaning that the available options are not consistent across views because of the data displayed in each view. You can select the options you want displayed in the menu by using the Filter Settings window. Click the Filter icon in the ribbon to display the Filter Settings window.
Every Filter Settings window in SQL Diagnostic Manager provides specific options for the current view. These options can include true or false fields that allow you to decide whether to show a particular item, filtering fields where you can enter an item name or even use a wildcard (%), dates and time ranges, and interval periods:
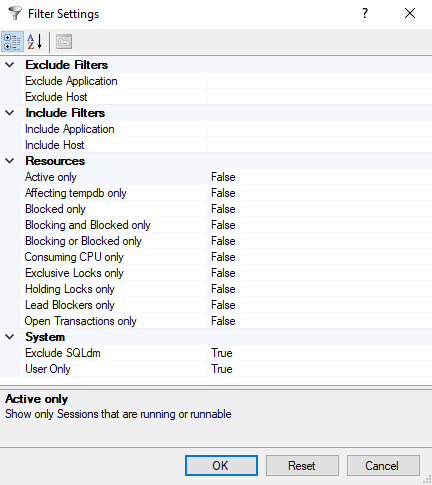
- Exclude Filters
- Exclude Application: Specify the Application you want to exclude in the filter, you can enter the application name or use the wildcard character.
- Exclude Host: Specify the Host name you want to exclude in the filter or use the wildcard character.
- Include Filters
- Include Application: Specify the Application you want to include in the filter, you can enter the application name or use the wildcard character.
- Include Host: Specify the Host name you want to include in the filter or use the wildcard character.
- Resources
- Active only: Select True or False to show only Sessions that are running.
- Affecting tempdb only: Select True or False to show only Sessions that are affecting tempdb (2005+only)
- Blocked only: Select True or False to show only Sessions that are blocked by other process.
- Blocking and Blocked only: Select True or False to show only Sessions that are being blocked by other session and are blocking other sessions.
- Blocking or Blocked only: Select True or False to show only Sessions that are being blocked by another session or are blocked other sessions.
- Consuming CPU only: Select True or False to show only Sessions that are consuming CPU cycles.
- Exclusive Locks only: Select True or False to show only Sessions that holding exclusive locks.
- Holding Locks only: Select True or False to show only Sessions that are holding locks.
- Lead Blockers only: Select True or False to show only Sessions that are leading a blocking chain.
- Open Transactions only: Select True or False to show only Sessions that have open transactions.
- System
- Exclude SQLdm: Select between True or False to exclude all Sessions associated with SQL Diagnostic Manager.
- User Only: Select between True or False to show only User Sessions and exclude all the System sessions.
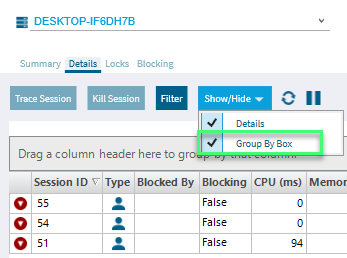
Use the Group By feature to organize your view
The Group By feature allows you to group the information shown in your views. To group your information by a column, check the Group By Box option, and then drag one or more column headings into the provided area as shown in the following image.
When you group data by multiple columns, be sure to select the headings in the hierarchy in which you want SQL Diagnostic Manager to display the results. After selecting the Group By Box check box, click, hold, and drag the first column heading (first order of grouping) into the grouping area. Next, click, hold, and drag the second column heading (second order of grouping) into the grouping area. Continue this process until you have the data hierarchy you want. Click the column headings to toggle sort order between ascending and descending.
You can remove a column from the grouping area by performing a click, hold, and drag of the column back into the grid area or by right-clicking the heading, and selecting Remove This Column.