SQL Diagnostic Manager consists of a light, unobtrusive architecture that easily runs in your SQL Server environment with minimal configuration. All SQL Diagnostic Manager components run outside and are separated from SQL Server processes.
SQL Diagnostic Manager Console
Use the SQL Diagnostic Manager Console to:
- View real-time status
- Configure alert notifications on specific metric thresholds at the server and database levels
- View historical reports
- Perform administrative functions
The SQL Diagnostic Manager Console retrieves historical information directly from the SQL Diagnostic Manager Repository. All real-time requests use the SQL Diagnostic Manager services to poll the monitored SQL Server.
SQLDM Web Console
Use SQLDM Web Console to monitor in real-time your SQL Diagnostic Manager environment. When installing SQLDM Web Console two services are added:
- Idera SQLDM Web Console UI service
- Idera SQLDM Web Console REST API service
Unlike IDERA Dashboard, SQLDM Web Console does not have a repository any or other components than the UI files installed with the UI service.
SQLDM Web Console is compatible with the Index Repository of DMSO, displaying a full overview of all instances for all Diagnostic Manager installation registered with the index repository.
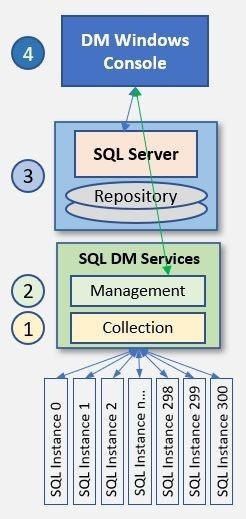
SQL Diagnostic Manager Architecture
SQL Diagnostic Manager’s architecture is a compound of four separate subsystems that help you to monitor your SQL Server environment.
Collection service - periodically contacts numerous monitored instances to gather statistics.
Management service - takes data from the collection service and places it in a repository.
SQL Server - implements the repository structure.
Windows Consoles (one or more) - sends requests to repository and management service.
Below you can find more information about its importance during the monitoring process.
SQL Diagnostic Manager Services
SQL Diagnostic Manager has four centralized services, the Management Service, the Collection Service, the Predictive Service, and Rest Service. These four services reside on the same computer.
The Management Service
The Management Service performs the following primary functions:
- Provides real-time data to the SQL Diagnostic Manager Console
- Receives historical data from the Collection Service for storage in the Repository
- Raises alerts and sends alert notifications
The Collection Service
The Collection Service performs on-demand and scheduled collection from the monitored SQL Servers.
The Predictive Service
The Predictive Service is used for Alert Forecasting and performs the following primary functions:
- Calculates the Alert Forecast every hour
- Builds a forecasting model once a day
The Rest Service
SQL Diagnostic Manager Plug-in
When SQL Diagnostic Manager is registered with the IDERA Dashboard, the product plug-in module is deployed. The SQL Diagnostic Manager plug-in consists of web views and widgets and a .NET based add-in module (SQL Diagnostic Manager add-in). The web views and widgets are deployed in the Web Application Service of the IDERA Dashboard, and the SQL Diagnostic Manager add-in in the Core Service of the same.
The Web Application Service dynamically loads in SQL Diagnostic Manager's views and widgets and makes them available to web console users. The views and widgets use the SQL Diagnostic Manager add-in REST APIs to retrieve data. Likewise, the SQL Diagnostic Manager add-in retries data from the product services and Repository.
SQL Diagnostic Manager Repository
The SQL Diagnostic Manager Repository is a centralized SQL Server database that stores collected metrics on a scheduled basis, historical data, and alerts information. The SQL Diagnostic Manager Repository also stores configuration information, such as the credentials used to monitor a registered SQL Server instance.
SQL Diagnostic Manager 10.1 and later requires Microsoft SQL Server 2005 or above running on the computer that hosts the SQL Diagnostic Manager Repository database for all installations.
Authentication in SQL Diagnostic Manager
SQL Diagnostic Manager uses the same types of authentication available in the SQL Server security model. When specifying account credentials for the SQL Diagnostic Manager services, you can use Windows Authentication or SQL Server Authentication.
When considering which authentication to use, keep in mind that SQL Server Authentication is required when no domain trust exists between the SQL Diagnostic Manager Services computer and the computers hosting the monitored SQL Server instances. For example, if the monitored SQL Server instances are located in an untrusted domain or behind a firewall, you must use SQL Server Authentication to successfully deploy SQL Diagnostic Manager. In this case, you must use the sa account or a SQL Server login that has System Administrator permissions.
For more information about these authentication types and the SQL Server security model, see the Microsoft document, Authentication in SQL Server.