My Views allows you to group servers to provide a high-level, global view of multiple monitored servers. This view includes basic statistics about your registered SQL Server instances and quick links to more detailed information. A monitor displays statistics for each SQL Server instance included in the group.
Access My Views
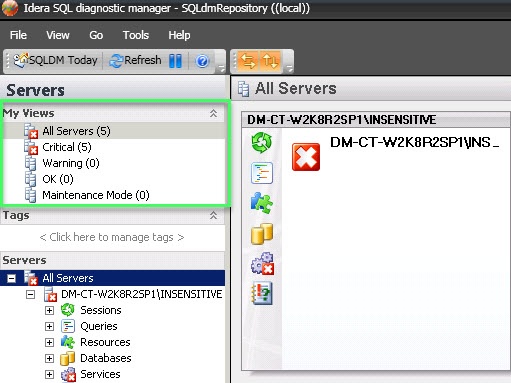
My Views is available at all times as part of the Navigation pane as shown in the following image.
Use the group list
SQL Diagnostic Manager updates the data shown in the thumbnails view of the group list according to the interval entered in the Status and Alerts Refresh field on the Console Options window, accessed by clicking Tools > Console Options. This information is collected from the last data point stored in the SQLdm Repository.
By default, the group list displays basic statistics for each of the SQL Server instances monitored by SQL Diagnostic Manager. This information includes the following statistics for each instance:
Response Time
Refers to the time it takes for a query to go from the SQLDM Console to the SQL Server instance and back.
User Sessions
Refers to the total number of SQL Server user sessions.
SQL CPU Usage
Refers to average percentage of SQL Server processor usage on the computer hosting the SQL Server instance.
SQL Memory Usage/Allocated
Refers to amount of memory in use by the monitored SQL Server instance.
SQL Disk I/O
Refers to the number of physical reads and physical writes made by the SQL Server instance between refreshes. If you see a high percentage of physical reads, you can improve performance by allocating more memory to the SQL data cache.
Customize the monitors in your group list
SQL Diagnostic Manager allows you to customize the monitors displayed in group lists so that you display only those key statistics and charts that are most important to you.
To customize a monitor:
- Right-click a SQL Server instance in the view.
- Select Thumbnail and select the information type you want to display on your monitor.
Instead of listing statistics for the server, SQL Diagnostic Manager displays the individual chart of the data item you selected. To revert back, select Summary from the Thumbnail list.
Use the Server Thumbnails, Details, or Configuration Properties window
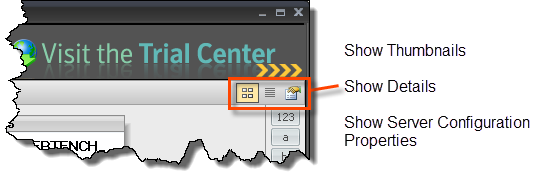
SQL Diagnostic Manager allows you to monitor multiple instances using different views, such as thumbnails of mini-monitors, a list of instances and their important details, or a list of instances and their server properties. SQL Diagnostic Manager defaults to the thumbnails view. To access a different view, click the appropriate button in the upper-right corner of the window as shown in the following image.
If any of the metrics are missing from this view, you may need to enable OS metrics collection.
These views list all the data collected at the last refresh for all your monitored SQL Server instances. The Details and Server Configuration Properties views can assist you with comparing the status of a specific metric or property between two or more of your SQL Server instances.
Add a custom view
You may want to add a custom view to the My Views list to organize your SQL Server instances into specific groups for monitoring purposes. This is especially important if you are monitoring a large number of SQL Server instances and want information for a specific group of SQL Server instances. If you create views before adding your SQL Server instances to SQL Diagnostic Manager for monitoring, you can have these new instances added to your views by selecting the new view you create and then adding the SQL Server instances.
To add a new view:
- If you want to create a new view from the File menu, click File > Create View. If you want to create a new view from My Views, right-click within the My Views section, and then select Create View.
- Type a name for the view.
- Select the monitored SQL Server instances you want to include in this view.
- Click Add > to move the selected instances from Monitored Instances to View Instances.
- Click Create to create your new view.