The Query Monitor is a standard SQL Server trace that collects all the events that occur on your SQL Server instance over a period of time. You can enable this option if you experience query timeouts or other performance issues.
By default, the Query Monitor option is not enabled.
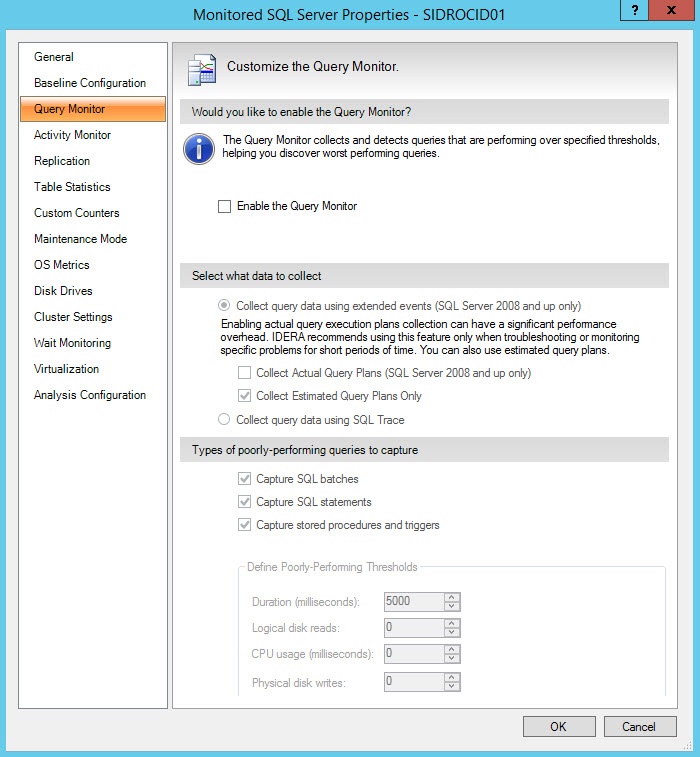
The Query Monitor window allows you to enable or disable query monitoring using the Enable the Query Monitor check box. You can also select the settings that are used:
Query data collection
You can select to collect query data using Extended Events (Collect query data using extended events radio button) or SQL Trace (Collect query data using SQL Trace radio button). For instances running SQL Server 2008 or higher, the Query Monitor uses by default Extended Events. First introduced in SQL Server 2008, Extended Events provide a new mechanism to capture information about events inside the Database Engine and diagnose performance problems. This functionality is highly efficient and lightweight. For more information about using Extended Events, see the Microsoft document, Extended Events.
To capture query data for monitored pre-SQL Server 2008 instances, enable the SQL Trace collection option. Enabling this option can degrade performance on your SQL Server.
SQL Trace and Query Execution Plans
Query Execution Plan capturing is not available if you choose SQL Trace for the Query Monitor. Upon selecting the Collect query data using SQL Trace radio button, the Collect query data using extended events (SQL Server 2008 and up only) radio button is disabled.
Query Execution Plans collection
Query Execution Plans display how the SQL Server Database Engine navigates tables and uses indexes to access or process the data for a query or other DML Statement. To analyze a slow-running query, you can examine the query execution plan and pinpoint the root of the problem.
To collect query execution plans, click Collect query data using extended events (SQL Server 2008 and up only) in the Query Monitor window. By default, this option enables the collection of estimated query plans only. If you would like to collect actual query plans instead, select the Collect Actual Query Plans (SQL Server 2008 and up only) check box.
For instances running SQL Server 2008 or higher, the Collect query data using extended events (SQL Server 2008 and up only) and the Collect Estimated Query Plans Only check boxes are enabled by default.
Enabling actual query execution plans collection can have a significant performance overhead, so IDERA recommends using this feature only when troubleshooting or monitoring specific problems for short periods of time. You can also use estimated query plans.
Capturing poorly-performing queries
The types of poorly-performing queries to capture include:
- SQL batches
- SQL Statements
- Stored procedures and triggers
You can also define specific poorly-performing thresholds such as duration, logical disk reads, CPU usage, and physical disk writes.
Diagnosing specific performance issues
Select the events that help you best diagnose the specific issues occurring with query performance on your SQL Server instance. For example, you may want to monitor queries taking a long time to complete, requiring heavy CPU usage, and causing a large number of logical disk reads or physical disk writes, which indicates a memory issue.
SQL Diagnostic Manager uses tracing to locate and flag worst-performing T-SQL. SQL Diagnostic Manager cannot display binary data in a readable format. If you captured DTS packages, you may see unreadable characters in the Command field of the Tree View. Capturing DTS data may also adversely affect the performance of the SQL Server or Data Warehouse you are monitoring.
Access the Query Monitor tab
You can access the Query Monitor tab of the Monitored SQL Server Properties window by right-clicking the appropriate SQL Server instance, and then selecting Properties. Click Query Monitor when SQL Diagnostic Manager displays the Monitored SQL Server Properties window.