The Alerts tab of the SQL Diagnostic Manager web console allows you to view all alerts for all the servers in your environment. The information displayed in this view includes:
- Alert start date & time
- Summary
- Instance
- Database
- Category
You can organize the alerts in the list using either the Current View or the Filter. Click image to view full size.
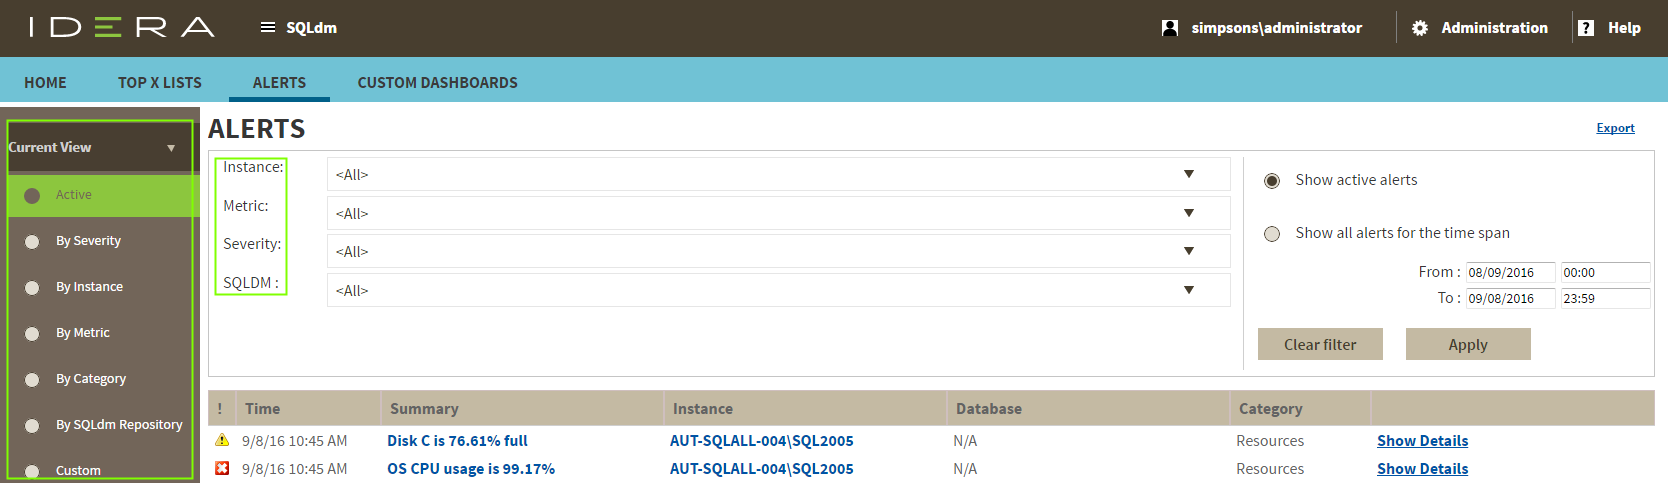
Organize your alerts by the Current View
You can organize your alerts by selecting one of the following views from the Current View section.
Active
Organizes all your alerts that are currently active.
By Severity
Organizes all your alerts by their severity.
By Instance
Organizes all your alerts by monitored SQL Server instance.
By Metric
Organizes all your alerts by each of the metrics affected.
By Category
Organizes all your alerts by their category.
By SQLDM Repository
Organizes all your alerts by SQL Diagnostic Manager Repository.
Custom
Organizes all your alerts by selected time range.
Organize your alerts using the Filter
You can organize your alerts using the available filter options. Filter options help pinpoint to data you want to view.
You can filter by SQL Server instance, metric, severity, SQL Diagnostic Manager Repository, and time range.
To apply new filters, select the clear filter button first.
Additional options
Access the single instance dashboard by clicking the instance name in an alert row.
Access the Alerts Detail screen by clicking Show Details.