The web console's main dashboard is comprised of three main sub-views:
These sub-views display all data collected at the last refresh for all your monitored SQL Server instances. To access any sub-view, click the appropriate button in the upper-right corner of the dashboard as shown in the following image:
|
List sub-view
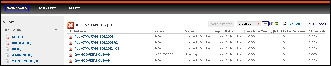
The list sub-view is the view by default in the SQLdm web console's dashboard and offers a means to quickly identify the status of instances, as well as the possibility to navigate to the single instance dashboard when clicking on a specific row.
|
The list sub-view provides you with the following SQL Server information:
Instance Name
Displays the name of the monitored SQL Server instance.
SQL Server Version
Displays the edition and version of SQL Server software used in this instance.
SQL Server Status
Displays the status of the SQL Server service such as running, stopped, and paused.
SQL Agent Status
Displays the status of the SQL Server Agent service such as running or stopped.
DTC Status
Displays the status of the Distributed Transaction Coordinator service such as running or stopped.
Available Memory (MB)
Indicates how much available memory is allocated for SQL Server.
Blocked Sessions
Displays blocked process sessions information on the SQL Server instance.
CPU Activity
Displays the percentage of CPU consumed by your SQL Server, virtual machine, and host server.
Actions
Sort
Instances on the list sub-view are sorted by severity. To re-organize information, click a column header or select the option to group by severity or tags (Group By).
Export
You can export instance information in PDF, XLS, or XML by clicking EXPORT at the top of the list sub-view.
Show/Hide instances
You can hide/show instances information by clicking HIDE INSTANCES at the top of the list sub-view.
Thumbnail sub-view
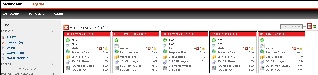
The thumbnail sub-view provides you with a graphical replication of your monitored SQL servers. Access additional details in the single instance dashboard by clicking on a thumbnail’s instance name or easily spot categories that have active alerts as marked by a critical icon. Navigate to an instance’s specific category view in case it has active alerts by clicking on the marked category icon.
|
The thumbnail sub-view displays basic statistics about your SQL Servers:
SQL Server version
Displays the edition and version of SQL Server software used in this instance.
Response Time
Refers to the time it takes for a query to go from the SQLdm Console to the SQL Server instance and back.
User Sessions
Refers to the total number of SQL Server user sessions.
SQL CPU Usage
Refers to average percentage of SQL Server processor usage on the computer hosting the SQL Server instance.
SQL Memory Usage
Refers to amount of memory in use by the monitored SQL Server instance.
SQL Disk I/O
Refers to the number of physical reads and physical writes made by the SQL Server instance between refreshes.
Category icons and actions
In the thumbnail sub-view, use your mouse cursor to hoover over a category icon in the left of the thumbnail and SQLdm displays two linkable options: Show Alert and Go To Category.
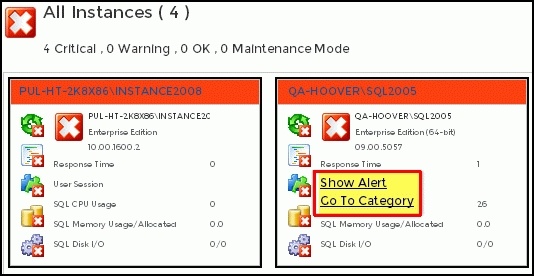
If the category icon contains active alerts, you can choose the Show Alert link to access the Alerts Detail screen. If there are no active alerts, you can click a category icon and you are directed to a specific category view in the single instance dashboard.
The table below shows the relationship between the category icons and their corresponding views:
| Icon | Category |
|---|---|
 | Sessions tab of the single instance dashboard |
 | Queries tab of the single instance dashboard |
 | Resources tab of the single instance dashboard |
 | Databases tab of the single instance dashboard |
 | Alerts Detail screen |
| Overview tab of the single instance dashboard |
Instances in thumbnail sub-view display according to severity. This means that critical instances show up on the top of the dashboard.
Heatmap sub-view
The heatmap sub-view provides you with a visual overall status of your SQL Server environment. Through its color scheme, you can easily identify which of your monitored instances need the most attention. From each heatmap, you can access basic statistics and specific instance category views.
|
|
The following colors in the heatmap sub-view are associated with a status and action within SQLdm:
| Color | Meaning |
|---|---|
| Green | Acceptable threshold where SQLdm does not generate an alert. |
| Yellow | Warning threshold where SQLdm generates a warning alert. |
| Red | Critical threshold where SQLdm generates a critical alert. |
| Orange | Monitored SQL Server in maintenance mode where SQLdm does not generate an alert. |
To access basic statistics about your monitored SQL Servers, first expand the heatmap of your choice by clicking the instance name. The information displayed includes:
SQL Server version
Displays the edition and version of SQL Server software used in this instance.
Response Time
Refers to the time it takes for a query to go from the SQLdm Console to the SQL Server instance and back.
User Sessions
Refers to the total number of SQL Server user sessions.
SQL CPU Usage
Refers to average percentage of SQL Server processor usage on the computer hosting the SQL Server instance.
SQL Memory Usage
Refers to amount of memory in use by the monitored SQL Server instance.
SQL Disk I/O
Refers to the number of physical reads and physical writes made by the SQL Server instance between refreshes.
Category icons and actions
In the heatmap sub-view, use your mouse cursor to hoover over a category icon in the left and SQLdm displays two linkable options: Show Alert and Go To Category.
If the category icon contains active alerts, you can choose the Show Alert link to access the Alerts Detail screen. If there are no active alerts, you can click a category icon and you are directed to a specific category view in the single instance dashboard.
The table below shows the relationship between the category icons and their corresponding views in the heatmap sub-view:
| Icon | Category |
|---|---|
| Sessions tab of the single instance dashboard |
| Queries tab of the single instance dashboard |
| Resources tab of the single instance dashboard |
| Databases tab of the single instance dashboard |
| Alerts Detail screen |
| Overview tab of the single instance dashboard |
Instances in heatmap sub-view display according to severity.