The Queries tab of the single instance dashboard lists each event that occurs in the Query Monitor and allows you to easily explore query data in multiple ways and get a handle of query performance in your environment.
The Queries tab provides a highly usable and customizable Main Query view along with two low-level views which you can navigate to for root cause analysis:
The Main Query view consists of the following major components that allow you to customize your view:
Select the type of view that you want displayed
The View Selection of the Main Query view allows you to choose from a variety of views to explore query data. The following views are available:
- Duration (ms)
- CPU Time (ms)
- Reads
- Writes
- I/O (sum of Reads and Writes)
- Blocking Duration (ms)
- Wait Duration (ms)
- Deadlocks
Duration (ms) is the default view of the Main Query view.
Use Group By to organize your view
Once you have selected a view, use the Group By option to choose from the following type of objects for query aggregation:
- Application Name
- Database Name
- User
- Client
- Query Signature
- Query Statement
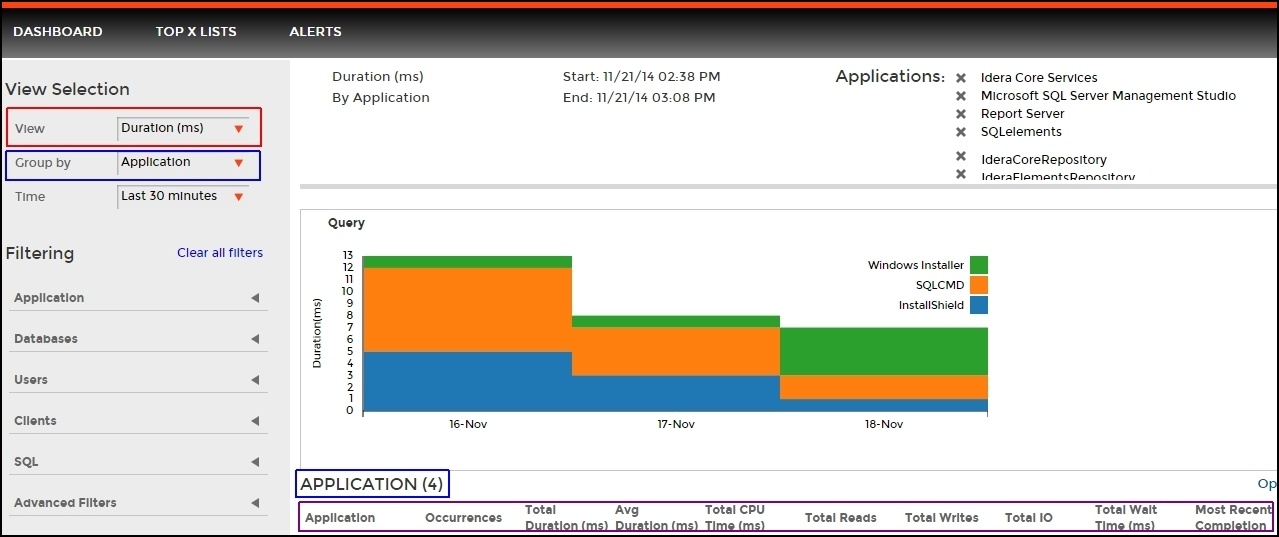
Application Name is the default grouping in the Main Query view.
Use Filtering to customize your view
Filter options in the Main Query view allow you to focus on only the information that you want displayed. You can include or exclude specific applications, databases, users, SQL text and more from the Query Monitor results through filters. The following filter options are available:
- Application
- Databases
- Users
- Clients
- SQL text
- Advanced Filters
Select a time period to display query data
You can choose the time period to display in the Main Query view. This selection limits the queries to only those that run during the specified time period. You can select from a broad range of built-in time periods or specify start and end dates, and times for the period. The Time box includes the following options:
- Last 30 minutes
- Last 1 hour
- Last 8 hours
- Last 24 Hours
- Last 7 days
- Last 30 days
- Custom
By default only queries that start within the time period are shown. If you want to modify this behavior, the Advanced Filters option lets you include incomplete queries or overlapping queries. For more information, see Advanced filters of the main query view.
To switch to a shorter time frame, click the larger time bucket. For example, clicking a month in a monthly graph modifies the time period to the selected month and grouping to days.
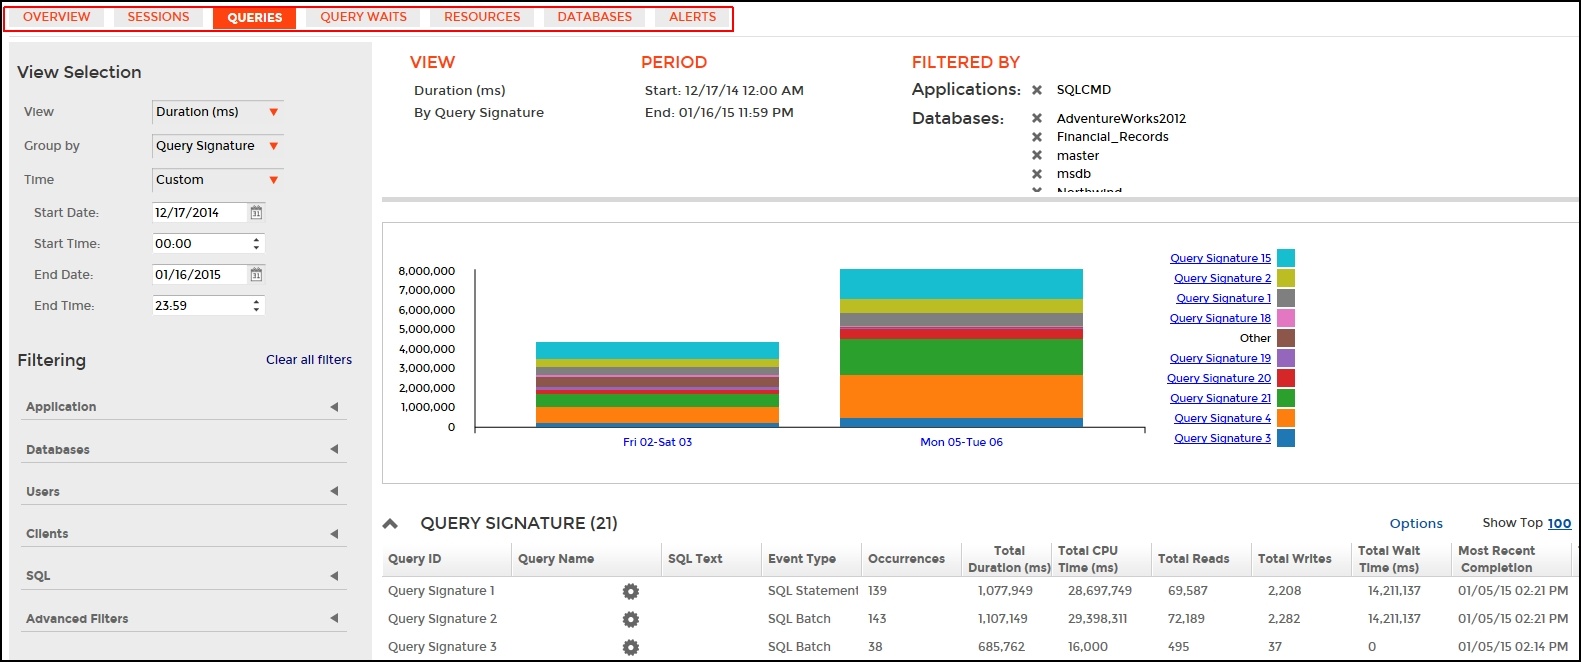
Analyze your query data
On the right hand side of the overall view, query data is displayed based on your View, Group By, and filtering selections. The Data view is designed to provide good visualization of the selected data and enable you to drill down into problem areas. The Data view is composed of the following elements:
Header
Provides View, Group By, Period, and filter criteria information.
Graph
Chart area which displays the aggregated query results that meet the filtering criteria.
List
Displays data selected for the view in list form. There are several list options according to your Group By selection in the Main Query view.
The table below shows what options you have to drill down from the graph or list and get more specific information:
Click the... | Access the… |
|---|---|
Application Name | Query Signature view |
Database Name | Query Signature view |
User | Query Signature view |
Client | Query Signature view |
Query Signature | Query Statement view |
| Query Statement | No drill down option |
You can return to the higher level view by clicking ![]() by the list name or by using the list context menu's Back option.
by the list name or by using the list context menu's Back option.
Access the Queries tab
SQLdm provides two paths to access the Queries tab. The first access path is by selecting the Queries tab of the single instance dashboard. You can also click on the query category icon of a specific instance in the thumbnail and heatmap views.