This interface shows the replication graph and relationship of all registered MySQL servers, as well as SLAVE STATUS and MASTER STATUS where it applies on hovering over each of the server block. The display gets updated after every one minute.
The servers are color-coded to represent the different states of the replication servers: green denotes stable, red disconnected servers and yellow not in sync. The yellow color is decided if any of the following variables return the below value:
'SLAVE IO RUNNING' = No
or
'SLAVE SQL RUNNING' = No
or
'SECONDS BEHIND MASTER' >= 450 Secs (this is the default global value for all the servers. A user can also set a value according to their MySQL environment)
From Monyog 8.1.0, the user can set the Seconds Behind Master threshold value for all the servers in SQL DM for MySQL by clicking the icon in the Seconds Behind Master column or in the dialog pop-up upon clicking the respective server in the table/topology.
There are two interfaces that the user can choose to see the information about the replication setup:
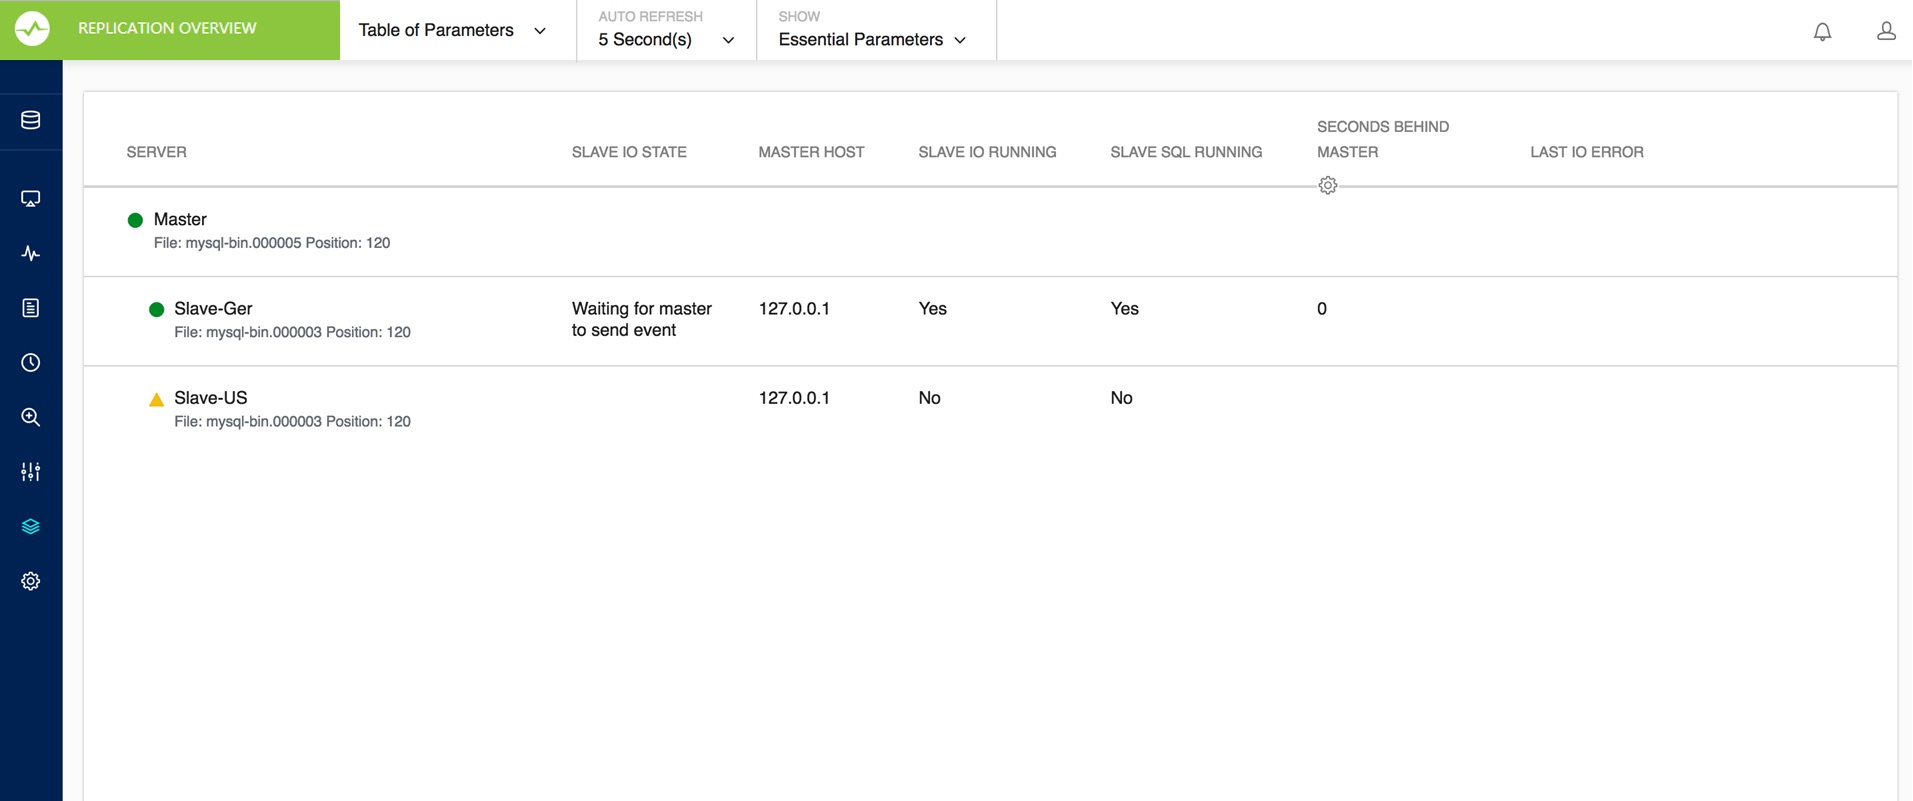
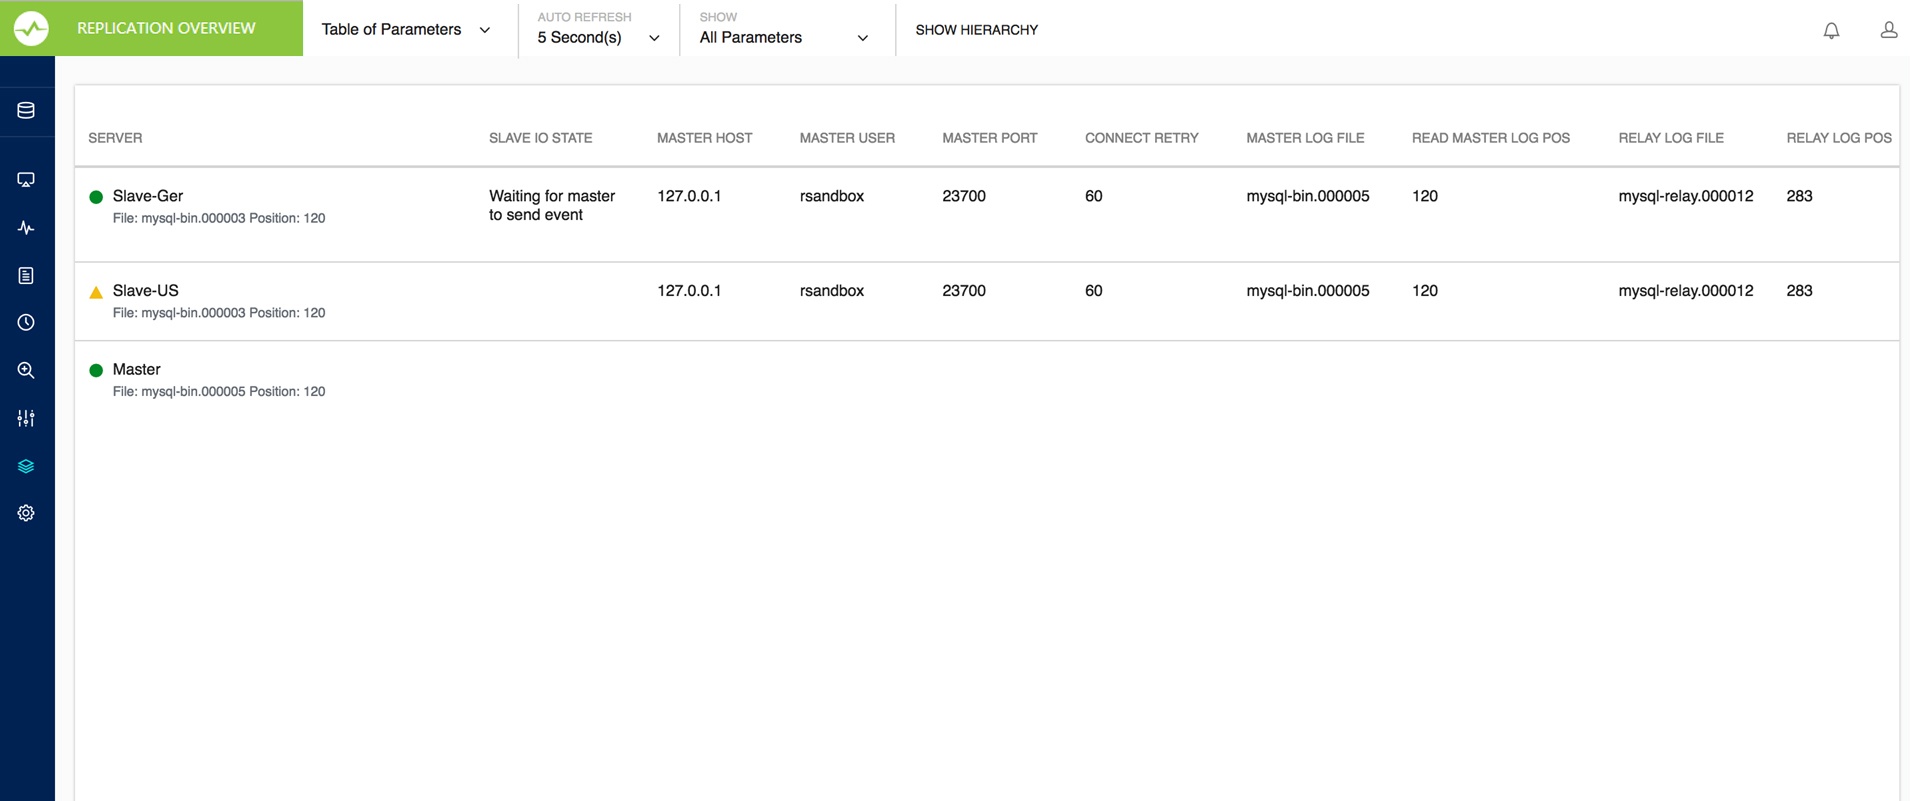
- Table of Parameters: This table contains the result set of SHOW [ALL] SLAVE STATUS for servers which have been marked as replication slaves in SQL DM for MySQL. The first time the number of columns in the table is condensed to only display 'Essential Parameters'. To get the detailed view, you can select the option ‘All Parameters’ from the drop-down menu in the header.
You can sort any column which removes the hierarchy listing of servers. To view slaves in the hierarchy, click the SHOW HIERARCHY link.
Also, if the I/O thread (‘Slave_IO_Running’) is not running, it dynamically brings out the Last IO Error column for a quick view on what went wrong with the Slave IO Thread. It works similarly for SQL thread (‘Slave_SQL_Running’) as well.
- Topology Chart: This interface shows the replication graph and relationship of all registered MySQL servers which are marked as master/slave, as well as SLAVE STATUS and MASTER STATUS while hovering over each of the server blocks.The display gets updated at the user-specified refresh interval which is a browser-specific setting. The default interval is 5 seconds.
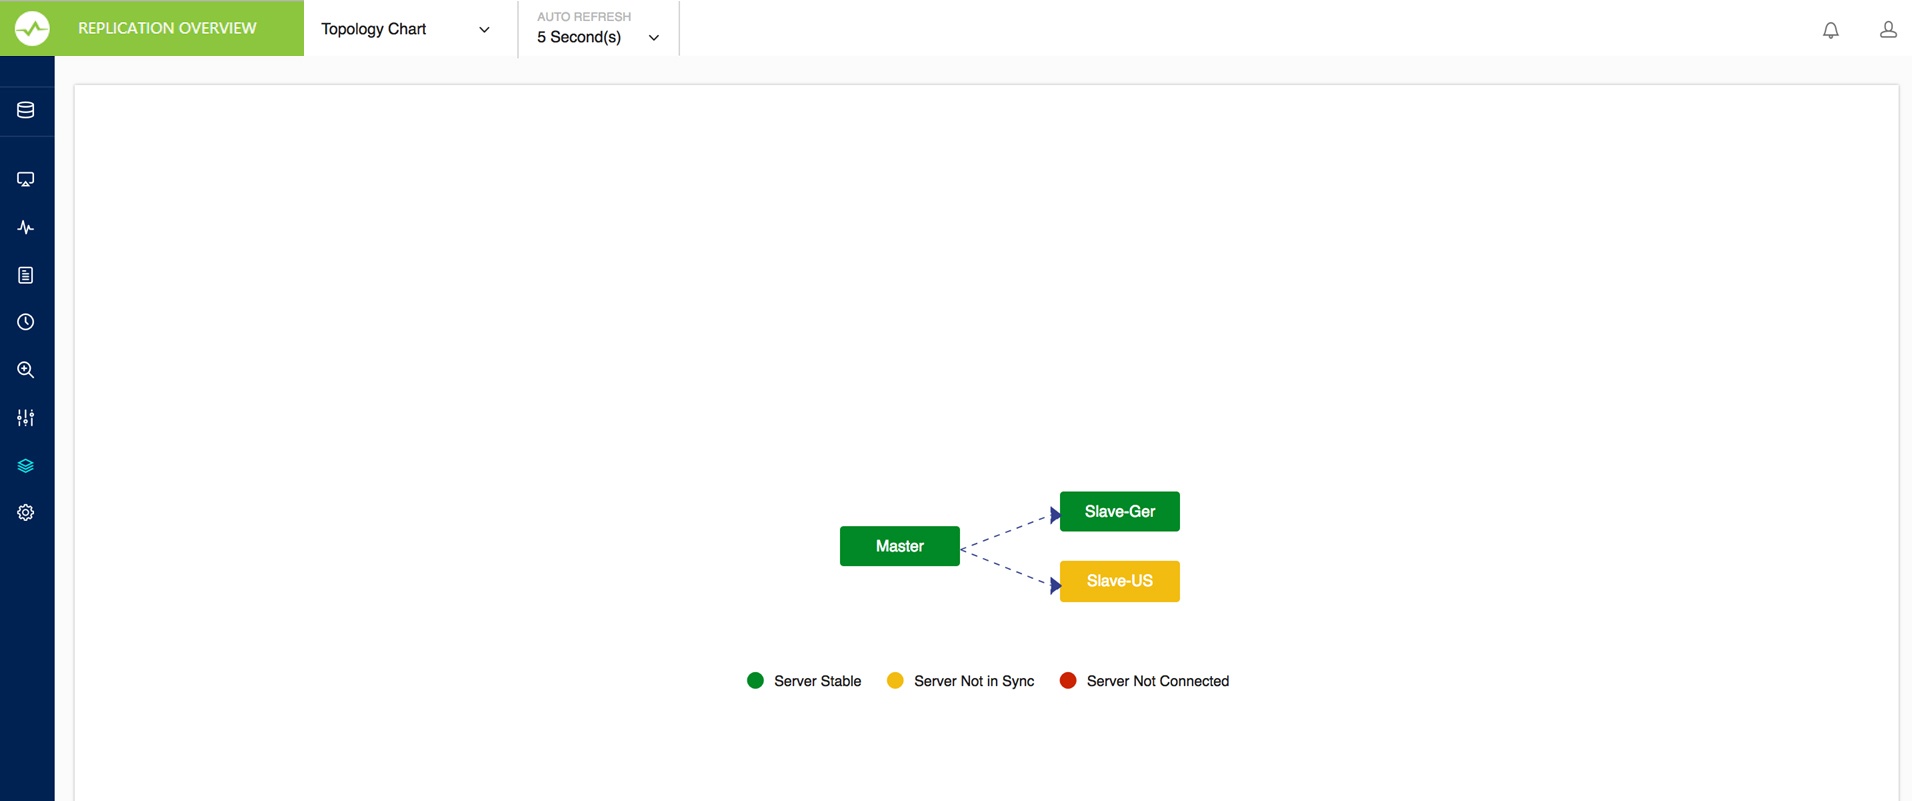
The server blocks on clicking gives the result set of SHOW [ALL] SLAVE STATUS for the slave and SHOW MASTER STATUS for the master servers.