The Analysis Wizard allows you to fine tune the type of analysis you want to perform on the target server. Note that analysis of the collected data may take several additional minutes and does not begin until the collection process is complete.
Access the Analysis Wizard
You can access the Analysis Wizard by clicking Analyze Server.
Analyze a SQL Server instance
To use the Analysis Wizard to analyze a SQL Server instance:
- Click Analyze Server. SQL Doctor displays the Analysis Wizard.
On the Select SQL instance tab, select the SQL Server instance you want to analyze, if the instance does not appear in the list, verify that the instance is registered. Select between Collect query-related data using Extended Events (SQL 2012+) or Collect query-related data using SQL Trace (if applies), and then click Next.
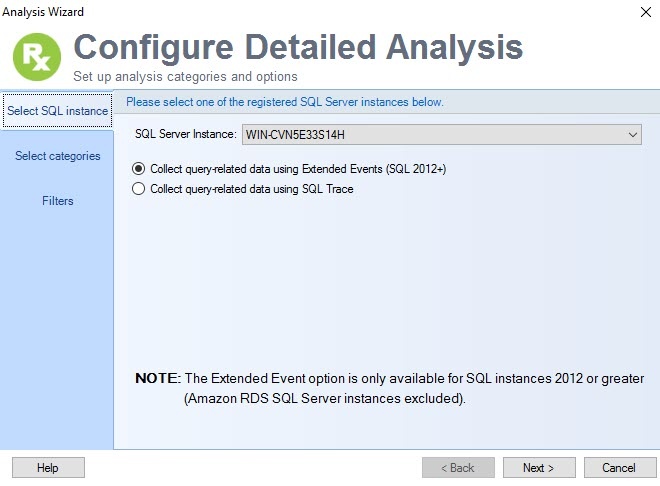
The Extended Events options is disabled when analyzing SQL Server 2005, SQL Server 2008 or SQL Server 2008 R2, and Amazon RDS SQL Server. The SQL Trace option is selected by default.
- On the Select categories tab, check the box for each category you want to include in the analysis. If you want more information about a category, select the category and SQL Doctor displays additional detail in the Category Description area.
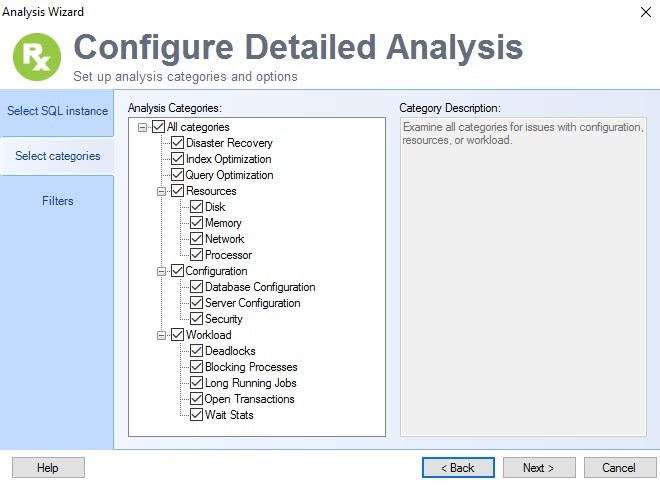
- After selecting the appropriate analysis categories, click Next.
- On the Filters tab, complete the following fields:
- If you want to analyze the workload from a specific location, type the name of the application using wild card characters (%) if necessary. If you want to limit your analysis to only one database, select the appropriate database from the list.
- Type the number of minutes you want SQL Doctor to spend collecting data. By default, SQL Doctor spends five minutes on this task.
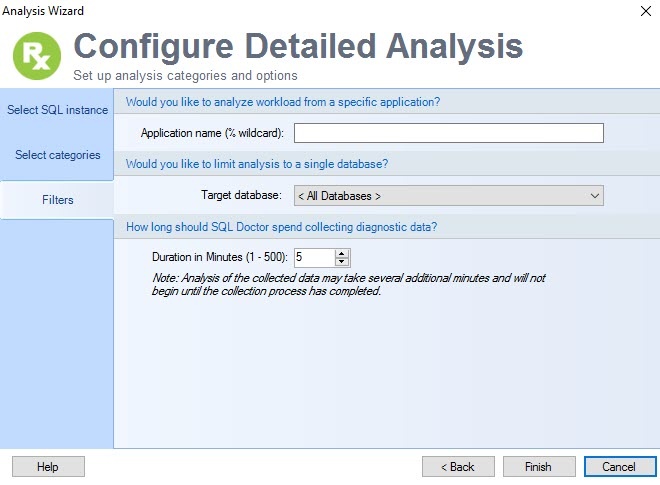
- Click Finish. SQL Doctor analyzes the selected instance.
View your analysis results
Once your analysis is complete, you can review your results by:
- Viewing the highest priority performance recommendations
- Viewing individual recommendation details for answers on how to fix the problem