Use the console tree to navigate to the Server Overview view and quickly see the overall health of this specific registered server, as of the last refresh.
This overview provides:
- A server health checklist that highlights where performance issues may be happening right now
- Real-time, key performance metrics for each major area of the server
- Quick findings based on the values of the key metrics so you can immediately start troubleshooting performance problems
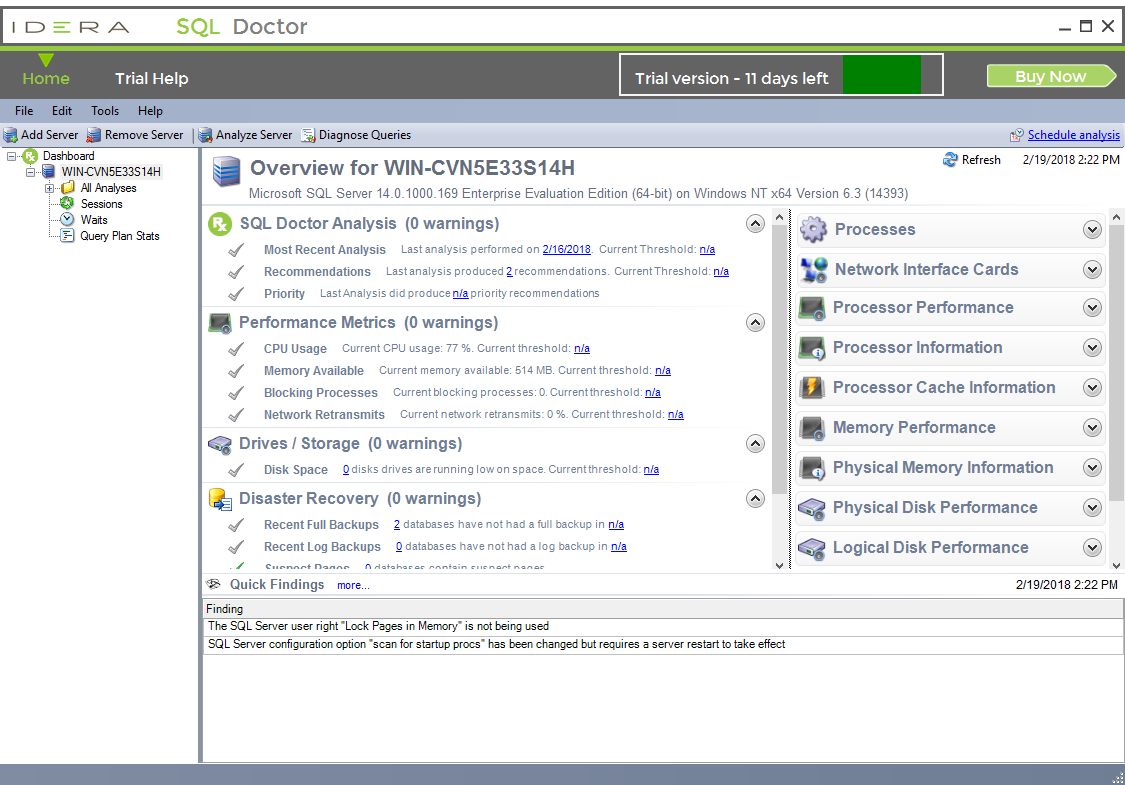
Each health checklist provides the current value of specific server properties and statistics, such as how much memory is available and how old the last database backup is, and warns you when a property or statistic exceeds the defined threshold. You can customize any of these thresholds to match the performance requirements for your servers.
For optimal performance, this view requires OLE automation to be enabled on the SQL Server instance.