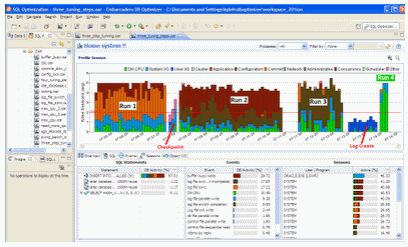
In the above SQL Query Tuner screen, the same workload was run 4 times. We can see that the time (width of the load) reduced, and the percent of activity on CPU increased.
Runs:
- log file sync, the orange color, is the biggest color area, which means uses are waiting on commits, still even though we are committing less in the code. In this case we moved the log files to a faster device. You can see the checkpoint activity just after run 1 where we moved the log files.
- buffer busy wait, the burnt red, is the biggest color area. We drilled down on the buffer busy wait event in the Top Event section and the details tell us to move the table from a normal tablespace to an Automatic Segment Space Managed tablespace.
- log file switch (checkpoint incomplete), the dark brown, is the largest color area, so we increased the size of the log files. (You can see the IO time spent creating the new redo logs just after run 3.)
- The run time is the shortest and all the time is spent on the CPU which was our goal, to take advantage of all the processors and run the batch job as quickly as possible.