The SGA contains all the SQL since the database has been started up, except for those that have been purged when the system runs out of memory. When analyzing the causes of a database bottleneck, it is perhaps more useful to view and tune the SQL statements most recently run, than those that have run in the last month, for example. SQL Query Tuner cannot tell you which statements have most recently run by looking in the SGA. However, by profiling the database using SQL Query Tuner Profiling and then optimizing the code by executing and running the generated cases, you will be able to see which paths are most likely causing a bottleneck and can be altered to enhance performance. Also, you can use IDERA Performance Center to continually monitor a database over a longer period of time to help you analyze and optimize database performance.
To add a statement active in the SGA
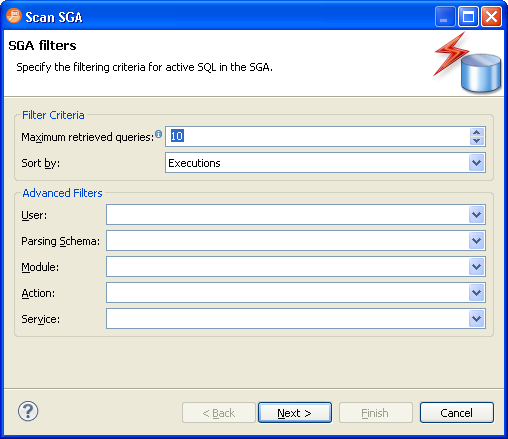
- From the Overview tab, click the SQL icon and select Scan Oracle SGA. The Scan SGA wizard appears.
- Set the filtering criteria for an SGA scan and then run the wizard.
- Choose the specific statements and add them to the tuning job.