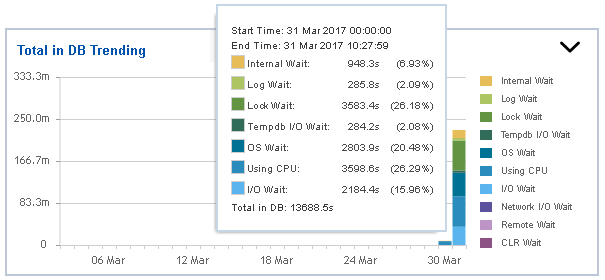
The Total in DB Trending graph displays information measured in seconds about Internal Wait, Log Wait, Lock Wait, Tempdb I/O Wait, OS Wait, Using CPU, I/O Wait, Network I/O Wait, Remote Wait, and CLR Wait. All Waits are color-coded and they are related to the Total in DB Highlights graph.
You can drill down into different time intervals, click and drag the rectangle over the graph.