Versions Compared

Key

  • This line was added.
  • This line was removed.
  • Formatting was changed.

SQL Diagnostic Manager allows you to collect and view wait statistics on the selected SQL Server SQL Server instance. Wait statistics offer one of the best means in diagnosing the reason ways to diagnose why a bottleneck is occurring on your system.

...

Tip

SQL Diagnostic Manager does not change Query Store selections at this time. Try the

Newtab2
aliasIDERA SQL Query Store Optimizer
urlhttps://www.idera.com/productssolutions/freetools/sql-query-store-optimizer
for more on Query Store improvements

Image RemovedImage Added

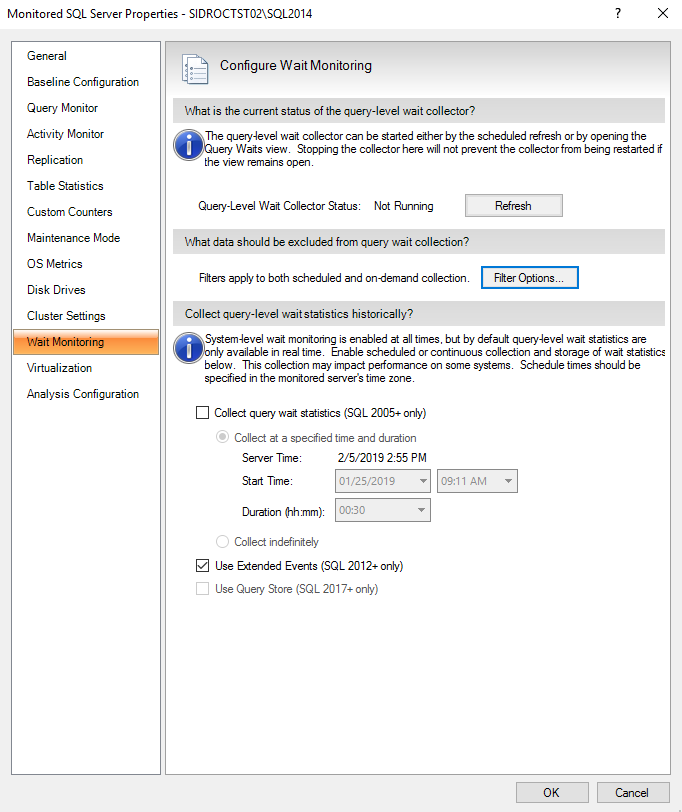
The Wait Monitoring tab of the Monitored SQL Server Properties window allows you to configure how SQL Diagnostic Manager collects wait statistics.

...

You can access the Wait Monitoring tab of the Monitor SQL Server SQL Server Properties window by right-clicking the appropriate monitored SQL Server SQL Server instance , and then selecting selecting  Properties. Click Wait Monitoring when SQL Diagnostic Manager displays the Monitored SQL Server Properties window.


SQL Diagnostic Manager for SQL Server performance monitoring, alerting, and diagnostics for SQL Server.
Scroll pdf ignore
Newtabfooter
aliasIDERA
urlhttp://www.idera.com
Newtabfooter
aliasProducts
urlhttps://www.idera.com/productssolutions/sqlserver
Newtabfooter
aliasPurchase
urlhttps://www.idera.com/buynow/onlinestore
|
Newtabfooter
aliasSupport
urlhttps://idera.secure.force.com/
|
Newtabfooter
aliasCommunity
urlhttp://community.idera.com
|
Newtabfooter
aliasResources
urlhttp://www.idera.com/resourcecentral
|
Newtabfooter
aliasAbout Us
urlhttp://www.idera.com/about/aboutus
|
Newtabfooter
aliasLegal
urlhttps://www.idera.com/legal/termsofuse