Page History
...
The types of non-query events to capture include:
- Capture Deadlocks (SQL 2005+)
- Capture Autogrow
- Capture Blocking (SQL 2005+)

Non-query activities data collection
...
Capturing blocking information allows the associated blocked alert to provide details on blocking and blocked sessions on the Alerts view. Blocking monitoring is supported on monitored instances running SQL Server 2005 or greater and is dependent on Activity Monitor. To access this information, check Enable the Activity Monitor and Capture Blocking (SQL 2005+) in the Activity Monitor window. Key details provided for blocking and blocked sessions include:
Blocking process details:
- Session ID
- Hostname
- User Name
- Application
- Database
- Last Batch Started
- Transaction ID
- Open Transactions
...
SQL Server 2005+ includes a new SQL Server Profiler event, the Blocked Process report. This event helps identify blocking issues and provides relevant information to solve these issues. In SQL Diagnostic Manager, you can take advantage of this feature by setting the blocked process threshold value according to your needs. To access the Blocked Process Threshold option, enable Capture Blocking (SQL 2005+) in the Activity Monitor window. Note that when this option is enabled, the blocked process threshold value is automatically set to 30 5 (seconds) but can be modified as desired.

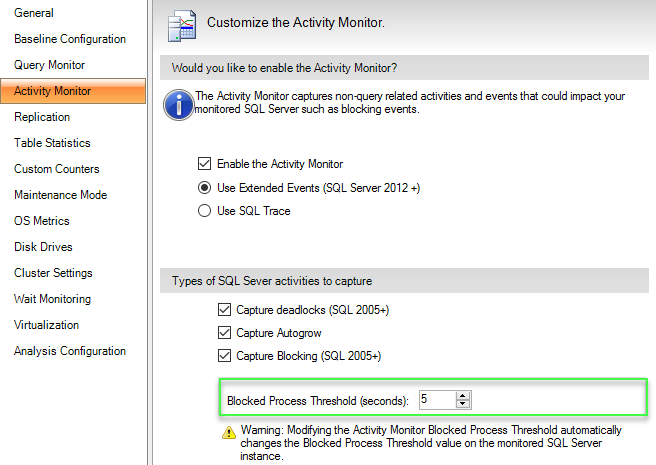
Since collecting information about blocked processes in SQL server is resource-intensive, IDERA recommends to set the blocked process threshold value to at least 5 (seconds) or your deadlock monitor runs constantly. For more information on this topic, see the Microsoft document Newtablink alias Increase or Disable Blocked Process Threshold. url https://technet.microsoft.com/en-us/library/bb402879.aspx
...