Page History
What is the IDERA Dashboard?
The IDERA Dashboard is a common technology framework designed to support the entire IDERA product suite. The IDERA Dashboard allows users to get an overview of the status of their SQL Servers and hosted databases all in a consolidated view, while providing users the means to drill into individual product dashboards for details. The IDERA Dashboard It also includes widgets that consolidate data across the products . The IDERA Dashboard and supports multiple copies of SQL Diagnostic Manager installations. To access the IDERA Dashboard, select IDERA Dashboard from the Product menu.For more information, please review the
| Newtab2 | ||||
|---|---|---|---|---|
|
...
|
...
In the IDERA Dashboard menu bar, you can perform the following actions:
...
.
...
Product menu
The Product menu allows you to quickly toggle between all of your installed IDERA products. You can customize the default order of your products in the Product menu by selecting the Customize option from the drop-down list and then clicking, holding, and dragging the product labels to the desired order. After selecting the order, click Save to save the changes.
| Info |
|---|
If the product list is long, the IDERA Dashboard displays the option More at the bottom of the menu. Click More to expand the next products in the list. |
Welcome user
The user menu, which displays Welcome <domain\username>, allows you to manage the user account (if the user has the Product Administrator role) and log out of the IDERA Dashboard session. Click Manage Accounts to display the Manage Users view with the current user account selected and the details displayed in the User\Group Details pane.
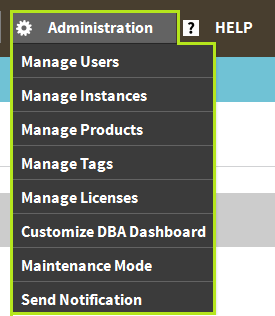
Admin menu
The Admin menu provides a list of shortcuts to the views available on the Administration tab.
| Note |
|---|
If a menu item is displayed but disabled, the current user account does not have the permission necessary to perform the associated function. |
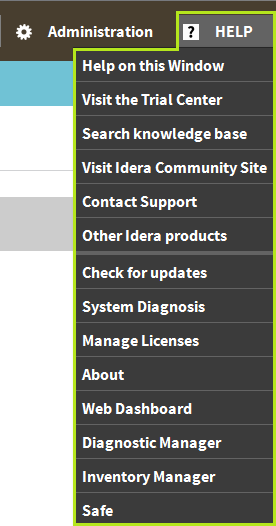
Help menu
The Help menu provides links to helpful areas such as the IDERA Knowledge Base or the IDERA Customer Support.
IDERA Dashboard Tabs
The IDERA Dashboard is comprised of the following tabs:
...

In the Overview tab, you can perform the following actions:
- Expand or collapse a widget
 .
. - View a widget in full size
 .
. - Remove a widget
 .
. - Filter widget information by Products and by Tags.
| Tip | ||
|---|---|---|
| ||
Users can customize the main navigation tab order of the IDERA Dashboard in the Configure Navigation order widget of the Administration view. |
| Tip | ||
|---|---|---|
| ||
Users can customize the Overview tab by adding, removing, and arranging widgets in the Configure Dashboard Views widget of the Administration view. |
...

In the Details tab, you can perform the following actions:
- Expand or collapse a widget .
- View a widget in full size .
- Remove a widget .
- Filter widget information by SQL Diagnostic Manager Repository.
| Tip | ||
|---|---|---|
| ||
Users can customize the Details view tab by adding, removing, and arranging widgets in the Configure Dashboard Views widget of the Administration view. |
...
In the IDERA Dashboard users can access information on all registered products current alerts and filter them based on:
- Product
- Category
- Severity
- Metric
- Tag

...
