Page History
...
Indicates the operational status of the database such as Normal, Offline, or Suspect.
If you click any row of the Database roll up view, SQLdm directs you to the database tab of the single instance dashboard for more details.
...
- Date and time of alert inception
- Alert description
- Monitored SQL Server instance name
- Database name
- Alert category
...
If you click any row of the Active alerts roll up view, the Alerts Detail Screen displays.
| Tip |
|---|
To sort information in the Active alerts roll up view, click the column header of your choice. |
...
The single instance dashboard includes the following charts:
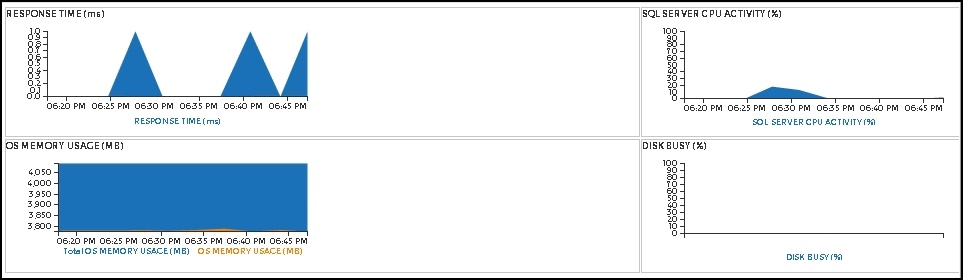
Response Time
The Response Time chart displays the response time (in milliseconds) it takes a Select SQL statement to go to the SQL Server instance and back. This chart indicates the current speed and congestion of the network as well as the speed with which SQL Server processes small queries. To obtain additional key diagnostic statistics for sessions on your SQL Server instance, click on the chart and you’re directed to the Sessions > Overview view. This view contains various charts like the Response Time (ms), Session Activity, and Blocked Sessions.
...
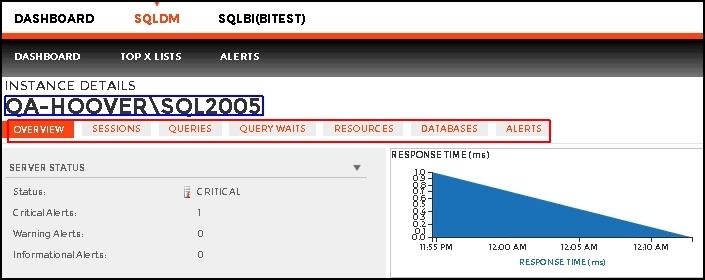
The single instance dashboard contains the Sessions, Queries, Query Waits, Resources, Databases, and Alerts tabs where you can see metrics and information on these category views.
From these tabs you can:
- View your SQL Server sessions information.
- View your SQL Server queries information.
- View your SQL Server query waits information.
- View your SQL Server resources information.
- View your SQL Server databases information.
- View your SQL Server alerts.
Access the single instance dashboard
SQLdm provides several paths to access the single instance dashboard. The first access path is by clicking the appropriate monitored SQL Server instance in the list, thumbnail, or heatmap sub-views. The second access path is by clicking on a specific instance from the Active Alerts panel, or the Most Critical Instances view in the main dashboard. It is also possible to access the single instance dashboard by clicking a specific instance or database in the Top servers by alert count, Top servers by response time, and Top databases by alerts widgets.
...
SQL Diagnostic Manager identifies and resolves SQL Server performance problems before they happen. Learn more > >
...