Page History
The Alerting option from the SQL Compliance Manager Menu allows users to configure their preferred email and SNMP settings, as well as to groom undesired alerts on your SQL Servers.
Available actions
Configure Email Settings
The Configure Email Settings window allows you to configure IDERA SQL Compliance Manager to connect to your mail server. This configuration is required to send alert email notifications. For more information, see Configure Email Settings window.
Configure SNMP Settings
The SNMP Configuration window allows you to specify the server address, port number, and community name of the network management console that you want to receive a IDERA SQL Compliance Manager alert notification as SNMP Trap messages. For more information, see SNMP Configuration window.
Groom Alerts Now
The Groom Alerts Now window allows you to groom alert messages currently stored in the Repository databases. Grooming permanently deletes any alert message that is older than the age limit you specify. For more information, see Groom Alerts Now window.
Available fields
Configure Email Settings
The Configure Email Settings window allows you to configure IDERA SQL Compliance Manager to connect to your mail server. This configuration is required to send alert email notifications. For more information, see Configure Email Settings window.
Configure SNMP Settings
The SNMP Configuration window allows you to specify the server address, port number, and community name of the network management console that you want to receive a IDERA SQL Compliance Manager alert notification as SNMP Trap messages. For more information, see SNMP Configuration window.
Groom Alerts Now
...
Configuration Check Report lists all the configurations selected on a Server or Database. Use these reports to reconcile the differences in regards to the configurations across different servers and databases.
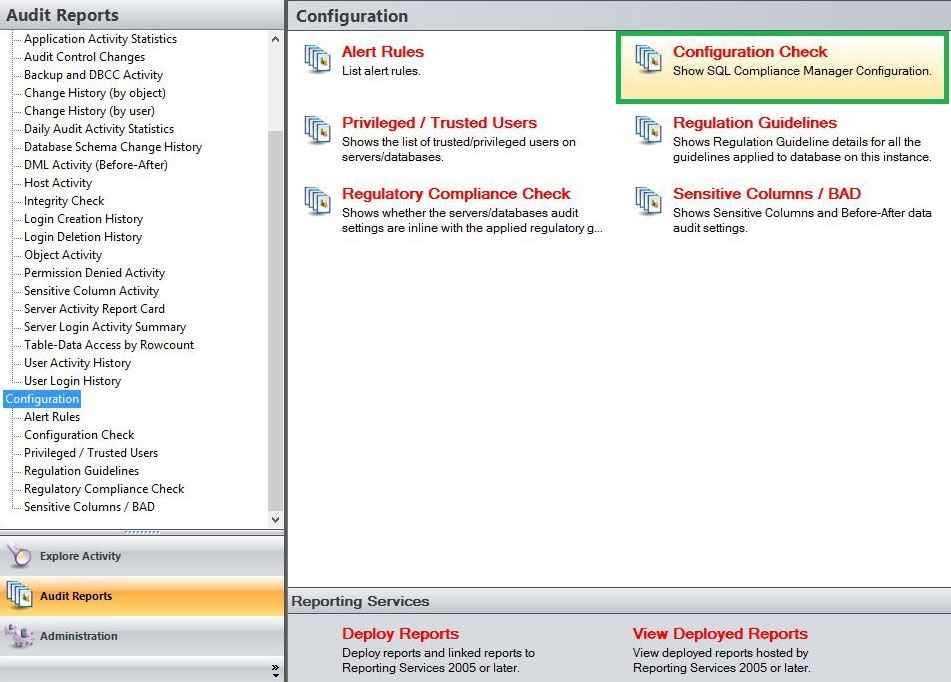
Available actions
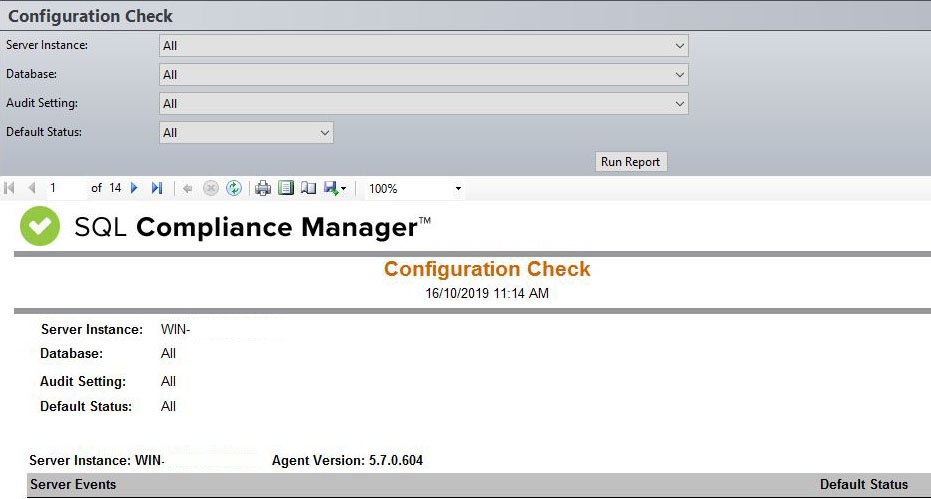
Server Instance
Allows you to select a registered instance on which you want to report. Select ALL to report on all instances.
Database
Allows you to select or type the name of one or more databases on which you want to report.
Audit Setting
Allows you to filter the report by specific audit setting. Select one audit setting from the drop down menu option.
Default Status
Allows you to compare what the current value setting is set to for that Server/Database compared to what the default setting is for that setting. Define the default status you want this report to filter by selecting between the following options; All, Same (Same value as the default) or Different (Different value as the default).
Run Report
Click this button to Run the report.
Default columns
Server Events
The Server Events column provides the name of the server event.
Default Status
The Default Status column allows you to compare the Individual Settings on the Server/Database with those that are set in your "Default" settings. If you have not set up "Default" Settings then it compares the settings against the IDERA Default Settings.
...