| Note |
|---|
SQL Compliance Manager is ONLY compatible with IDERA Dashboard version 4.6 and with limited support. |
The IDERA Dashboard Overview provides an area for users to quickly view top metrics regarding their monitored SQL Server instances.
By default, the following IDERA SQL Compliance Manager widget appears on the IDERA Dashboard Overview:
...
In the Overview tab, you can perform the following actions:
- Expand or collapse a widget
 Image Added .
 - View a widget in full size
 Image Added .
- Remove a widget
 Image Added.
- Filter widget information by Products and by Tags.
| Anchor |
|---|
| SQLCMEnvironmentAlertStatus |
|---|
| SQLCMEnvironmentAlertStatus |
|---|
|
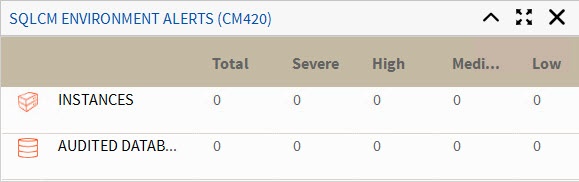
SQL Compliance Manager Environment Alerts widgetThe SQL Compliance Manager Environment Alerts widget displays the number of active alerts for the entire environment with Severe, High, Medium, or Low status along with the:
- Total number of audited instances in your environment. Click Instances to access the Audited Instances view within SQL Compliance Manager.
- Total number of audited databases in your environment. Click Audited Databases icon to access the Audited Databases view within SQL Compliance Manager.
| Anchor |
|---|
| SQLCMEnterpriseActivityReportCard |
|---|
| SQLCMEnterpriseActivityReportCard |
|---|
|
SQL Compliance Manager Enterprise Activity Report CardThe SQL Compliance Manager Enterprise Activity Report Card widget displays your SQL Compliance Manager enterprise activity in a line graph based on the Overall Activity graph on the SQL Compliance Manager Enterprise Activity report Card. This graph displays activity for the past seven days and includes:
...
For more information about the Enterprise Activity report Card, see Explore Activity - Audited SQL Servers Summary tab.
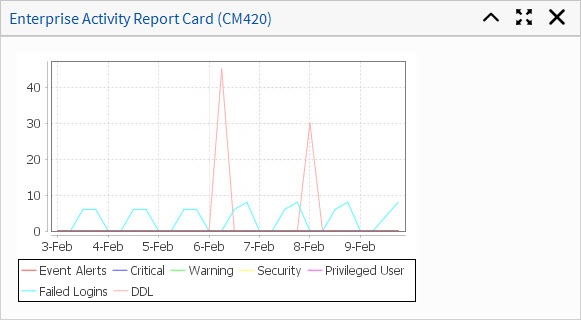 Image Modified
| Anchor |
|---|
| SQLCMAuditedInstances |
|---|
| SQLCMAuditedInstances |
|---|
|
SQL Compliance Manager Audited InstancesThe SQL Compliance Manager Audited Instances widget displays a list of audited SQL Server instances. This widget includes:
- status Status icon: green check for okay (successful connection and the SQL Server Agent is running) or red x for error (instance connection failed or the SQL server Agent is not running)
- Instance name
- Agent Status text
- any Any available alerts
- number Number of audited databases per instance (scroll right if not available)
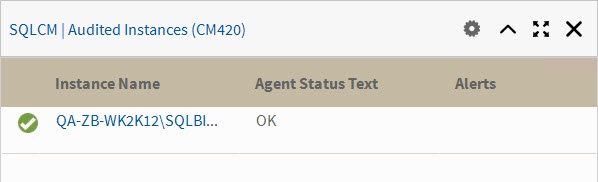 Image Modified