Page History
| Note |
|---|
SQL Compliance Manager is ONLY compatible with IDERA Dashboard version 4.6 and with limited support. |
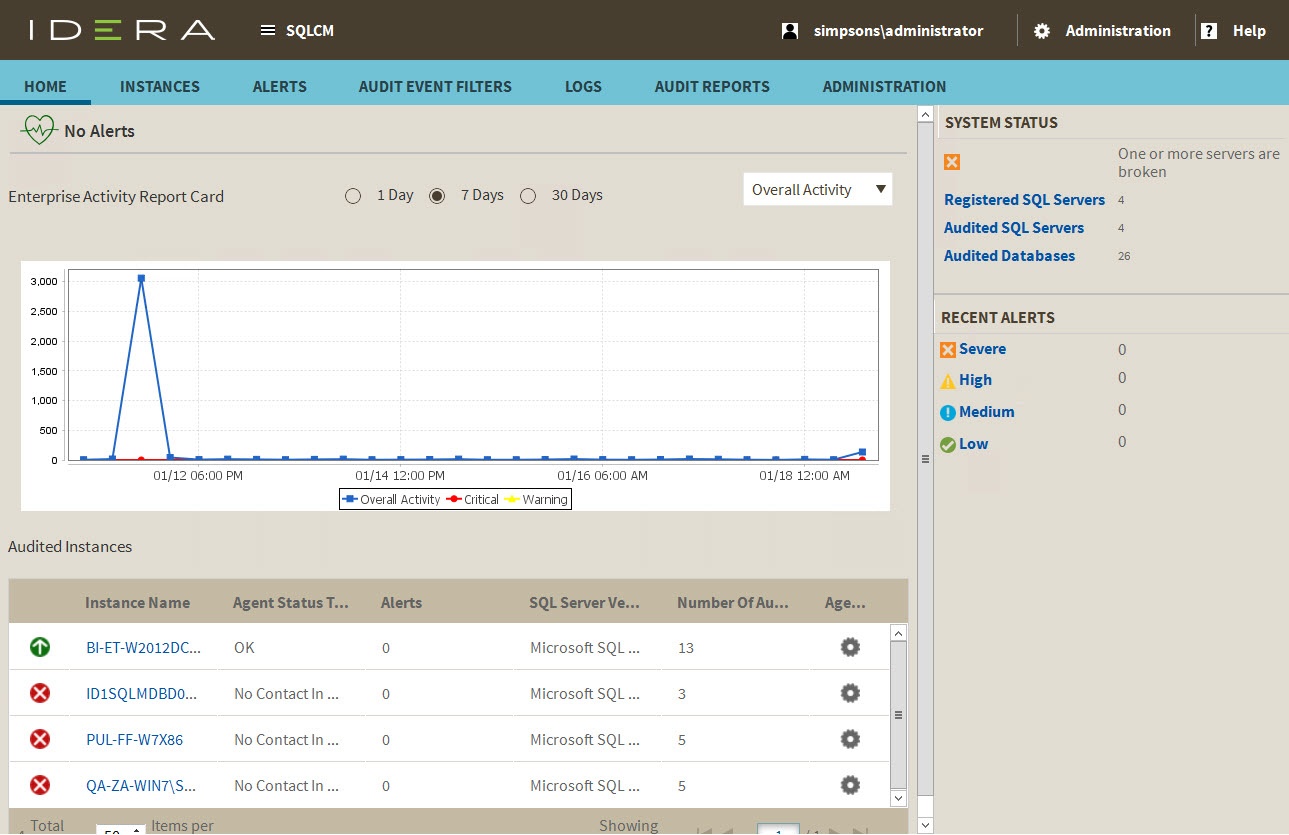
The Home tab is the default overview page of the product. This tab provides a high-level status of your audited instances and enterprise activity occurring within your environment.
 The overview provides the following sections:
Alerts
On the SQL Server Alerts IDERA SQL Compliance Manager performs health checks on your registered instances to help you monitor the most important issues across your environment. On this section of the Overview tab, SQL Compliance Manager shows you the most recent alerts occurring on the audited SQL Server instances in your environment, active alerts for your environment, grouped by alert type, and ordered by level of criticality. SQL Compliance Manager displays the first five instances and includes the ability to page through results. This table includes:
...
, where:
- Level 4 = Severe
- Level 3 = Critical
- Level 2 = Warning
- Level 1 = Informational
| Info |
|---|
You can click the options available for each alert to:
- Show Details of instances or databases affected by the respective alert.
- Individually Acknowledge the alert.
- Individually Dismiss the alert.
- Individually Clear the alert.
If you do not want to see these details, click Hide Details.
You can also get the most updated information for your alerts by clicking Refresh
...
.
Enterprise Activity Report Card
The Enterprise Activity Report Card allows you to review the status of your audited SQL Servers and the recent activity that has occurred on them for up to 30 days of SQL Server activity. Activity Report Cards allow you to view the SQL Server activity at the enterprise and individual SQL Server instance levels. These report cards allow you to quickly check activity in each event category audited, view SQL Server activity statistics, and short-term activity trends. Use Activity Report Cards to identify problems that might require more in-depth analysis based on:
- Overall Activity.
- Event Alerts.
- Failed Logins.
- Security.
- DDL.
- Privileged User.
For more information about the Enterprise Activity Report Card, see Explore Activity - Audited SQL Servers Summary tab.
Audited Instances
All audited SQL Server instances in your environment appear in the Audited Instances section of the Home tab. The default sort order displays the first five instances based on instance name. If you have more than five registered instances, SQL Compliance Manager allows you to page through the results. This table includes:
...
| Info |
|---|
Click the name of a SQL Server instance, and SQL Compliance Manager opens the Instance Details view for that instance. |
System Status and Recent Alerts area
On the right side of the IDERA Dashboard SQL Compliance Manager Home page, you can view the number of SQL Server instances and databases needing your immediate attention in addition to a count of recent alerts by severity.
System Status
The System Status area provides a summary your environment that includes the number of each device type needing attention, grouped by:Indicates whether IDERA SQL Compliance Manager encountered any issues while auditing your SQL Server environment. Click the status link to open the more detailed Audited Instances view. Use view to see the status of the audited databases on this instance, validate audit settings, and check the SQL Compliance Manager Agent status.
Registered SQL Servers
...
Displays the
...
number of SQL Server instances that are registered
...
with SQL Compliance Manager.
Audited SQL Servers
...
Displays the
...
number of
...
instances
...
currently audited. This number does not include instances where auditing is not yet configured or is disabled.
Audited Databases
...
Displays the
...
number of databases
...
currently audited. These databases are hosted by SQL Server instances that are registered with SQL Compliance Manager. This number does not include databases where auditing is not yet configured or is disabled.
Recent Alerts
View a count of recent alerts based on severity, whether Severe, High, Medium, or Low.
| Excerpt |
|---|
SQL Compliance Manager audits all activity on your server. Learn more > > |
For more information about the System Status area, see Explore Activity - Audited SQL Servers Summary tab.
Recent Alerts
The Recent Alerts pane displays the number of alerts that are generated for each alert category in the selected time span. If you see an unexpected number of alerts, consider reviewing the current alert messages and then modifying your alert rules to better fit your compliance and auditing needs.
For more information about specific alerts, see View alerts and alert rules. You can view which alerts are generated from multiple instances across your environment or from a particular instance.
...