Page History
...
- Blocked Sessions (Count)
- Client Computers (Count)
- Custom Counters
- OS Average Disk Queue Length (Count)
- OS Disk Time (Percent)
- OS Memory Usage (Percent)
- OS Paging (Per Second)
- OS Privileged Time (Percent)
- OS Processor Queue Length (Count)
- OS Processor Time (Percent)
- OS User Time (Percent)
- Page Life Expectancy
- SQL Server CPU Usage (Percent)
- SQL Server Response Time (Milliseconds)
To configure your alert thresholds:
- Configure the performance baseline.
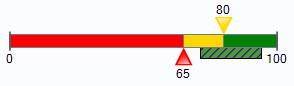
- View suggested alert thresholds. Ideally you should wait until the baseline period is over. About 24 hours after collections begin, SQL Diagnostic Manager displays a bar in green with black diagonal lines for related alerts on the Alert Configuration window, as shown in the following image. This bar represents you recommended reference range.
- As your performance baseline period ends, text appears at the top of your Alert Configuration window regarding available recommendations. Click the Alert Recommendation text to open the Alert Recommendations window for your SQL Server instance. This window allows you to see the thresholds SQL Diagnostic Manager recommends based on the data collected during your performance baseline.
- Either apply the alert recommendations or tweak your thresholds.
| Scroll pdf ignore | ||||||
|---|---|---|---|---|---|---|
Newtabfooter |
|
...
SQL Diagnostic Manager identifies and resolves SQL Server performance problems before they happen. Learn more > >
...