Page History
...
| Info |
|---|
You can also configure these options directly from the new advanced query views in the SQL Diagnostic Manager web console. See View your SQL Server queries information. |
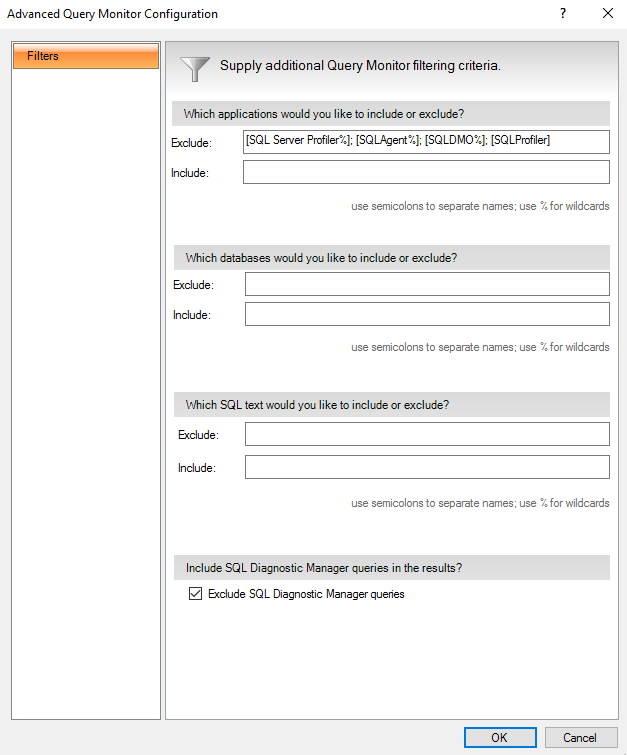
Access the Advanced Query Monitor Configuration window
You can access the Advanced Query Monitor Configuration window (click image to view full size) by right-clicking the appropriate monitored SQL Server SQL Server instance , and then selecting Properties. Click Query Monitor when SQL Diagnostic Manager displays the Monitored SQL Server Properties window, and then click Advanced.
...
| Tip |
|---|
When using Query Monitor filtering, take into account that Exclude takes precedence over Include. |
Anchor queryexclude queryexclude
Using Query Monitor exclusion filtering
| queryexclude | |
| queryexclude |
...
- On the Queries view for the server you want to include data in, press the Configure Query Monitor button.
- Click Advanced.
- Enter your filter information in the Include fields, using (;) to separate items and (%) as a wildcard.
- Click OK.
SQL Diagnostic Manager identifies and resolves SQL Server performance problems before they happen. Learn more > >
...