Page History
The Sessions tab contains the following views:
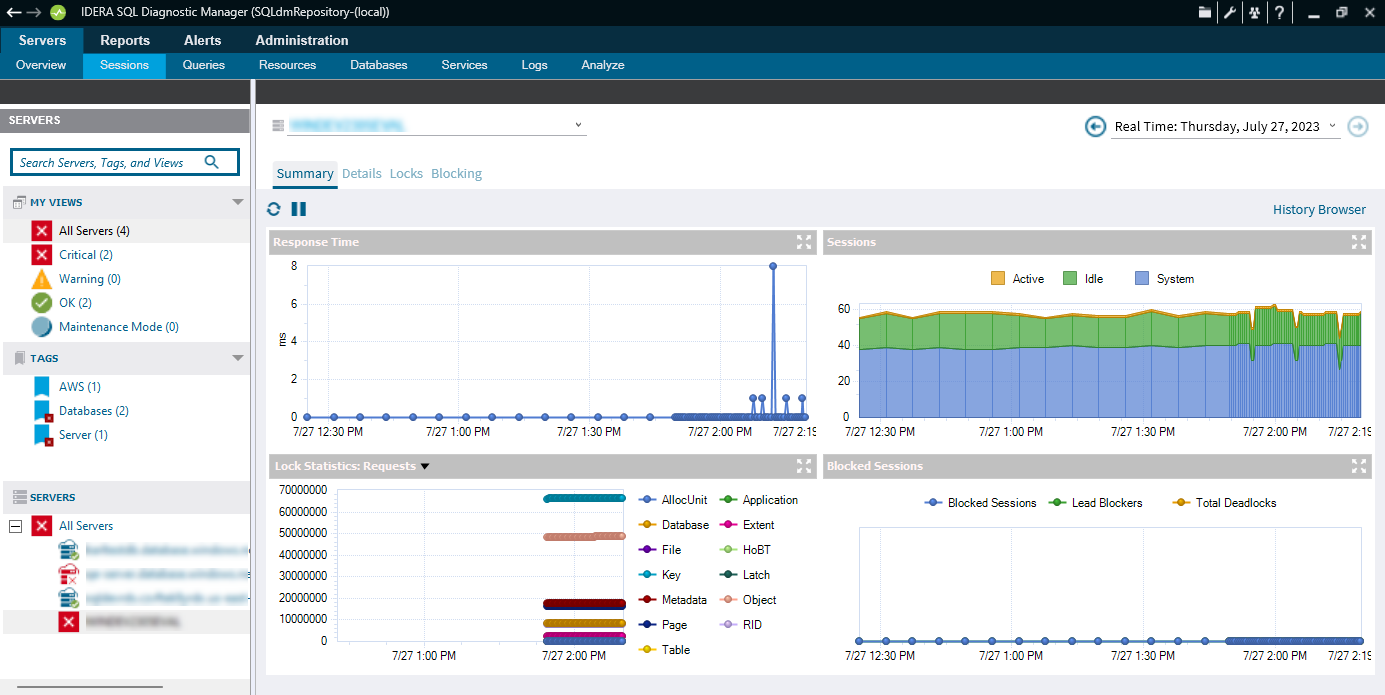
- Summary view where you : You can view charts for each Sessions statistic., the following charts are displayed in the Summary tab:
- Response Time
- Sessions
- Lock Statistics: Average Wait Time, Deadlocks, Requests, Timeouts, Waits, and Wait Time
- Blocked Sessions
- Details: Allows you to Details view that lets you create charts with the specific data items you need.
- Locks view that allows : Allows you to create charts based on each lock present on your SQL ServerSQL Server.
- Blocking view where : Allows you can to create charts specific to all the Blocking sessions.
The Sessions tab provides the following options:
- The ability to diagnose performance bottlenecks caused by blocking or locked sessions.
- The ability to trace specific sessions to see why the session may be blocking blocked or locked.
- The ability to kill sessions to improve system performance.
Access the Sessions tab
SQL Diagnostic Manager provides two paths to access Access the Sessions tab . The first access path is by clicking the appropriate monitored SQL Server SQL Server instance , and then clicking the Sessions tab. The second access path is by expanding the Servers tree, and then clicking Sessions for the appropriate instance.
Alerts associated with the Sessions tab
The following alerts are associated with the Sessions tab:
Blocked Sessions (Count)
Is the The number of sessions blocked by other sessions holding requested locks.
Blocking Session Wait Time (Seconds)
Is the The amount of time (in seconds) that a SQL Server session is blocking other sessions.
Client Computers (Count)
Is the The number of unique client computers connected to the instance.
Deadlock
Is Refers to when two processes are waiting for a resource held by the other process.
...
Query Monitor Events (Count)
Is the The number of queries captured by Query Monitor on the monitored SQL Server instance during the last scheduled refresh.
...
Provides the CPU time (in seconds) used by a SQL Server SQL Server sessions.
SQL Server Response Time (Milliseconds)
Calculating Calculates the sum of the response time (in milliseconds) to send a batch of SQL statements to the server, process the query, and return the results to the SQL Diagnostic Manager Console.
User Connections (Percent)
Is the The percentage of user connections allowed that are currently used.