Page History
The instance details Instance Details view allows you to see specific information for an instance. SQL Inventory Manager displays the instance´s instance health check recommendations, top databases, relevant information, and also allows you to get access to the instance´s instance host server computer details and configuration settings.
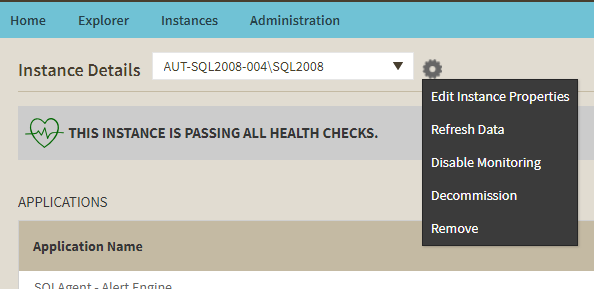
Additionally, on the instance details view, on the actions items bar, you can Click on the cog icon next to the instance name to find the following options:
- Export. Edit Instance Properties - Allows you to export the instance health check recommendations
- Edit Properties
- change select properties for this instance.
- Refresh data - Forces the system Refresh data. This option forces to collect data off-schedule so you can have the latest information for this instance.
- Disable Monitoring - Allows you to temporarily stop monitoring this instance.
- Decommission / Recommission - Allows you to decommission or recommission this instance.
- Remove - Allows you to remove instances that you no longer want to monitor.
If you click the drop-down arrow next to the instance name, you can choose a different instance to access its respective details.
Information available on the Instance Details view
...
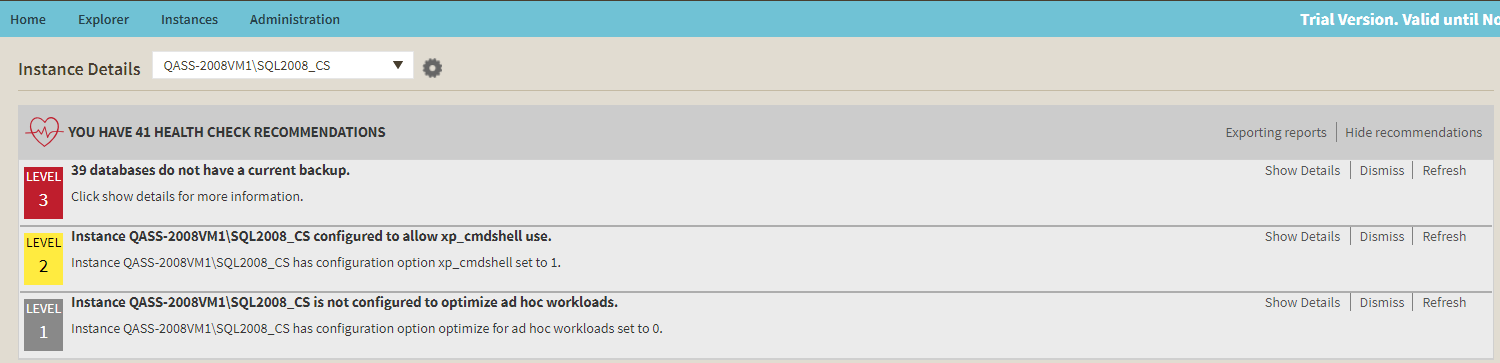
Health Check Recommendations
This section provides you with specific health check recommendations for the selected instance. SQL Inventory Manager groups these health checks by type, and orders them by level of criticality; where Level 3 is critical, Level 2 is warning, and Level 1 is informational.:
Level 3 = CriticalStatus colour Red
Level 2 = WarningStatus colour Yellow
Level 1 = InformationalStatus
You can choose to show details, hide details, dismiss, or refresh any health check recommendation. You can also export this information according to your required format. For more information on how to view health check recommendations for a specific instance, refer to Viewing Health Check Recommendations for a specific instance.
| Info | ||
|---|---|---|
| ||
To view what health checks are performed by SQL Inventory Manager, refer to What Health Checks are available in SQL Inventory Manager? |
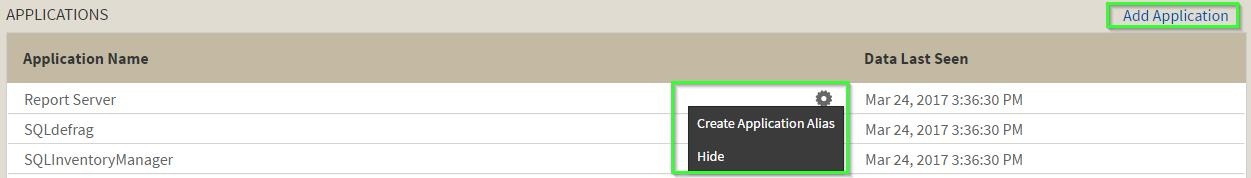
Applications
SQL Inventory Manager periodically takes a sampling of the applications connecting to each SQL Server instance. This sampling occurs approximately once every hour. The Applications list on the Instance Details view includes the name of the application along with the timestamp of the most recent sampling that included that application. You can also manually add an application to track using Add Application. For more information about this feature, see Manage instance applications.
Click the gear icon next to the application name to select one of the following options:
- Create Application Alias - Change the default name of the application to an alias that displays in the Applications list.
- Hide - Allows you to prevent SQL Inventory Manager from displaying this application in the list. Click Unhide to display any hidden applications.
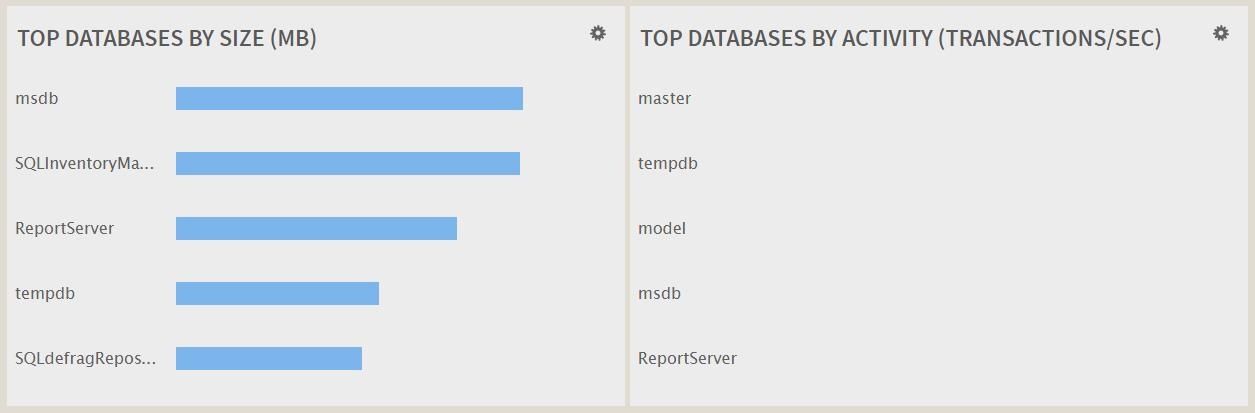
Top bar graphs
These graphs provide insight of the most important databases for your instance, based on databases size and how busy they are (transactions per second).
SQL Inventory Manager shows you the following bar graphs:
- Top Databases by size Size (MB).
- Top Databases by Activity (Transactions per second).
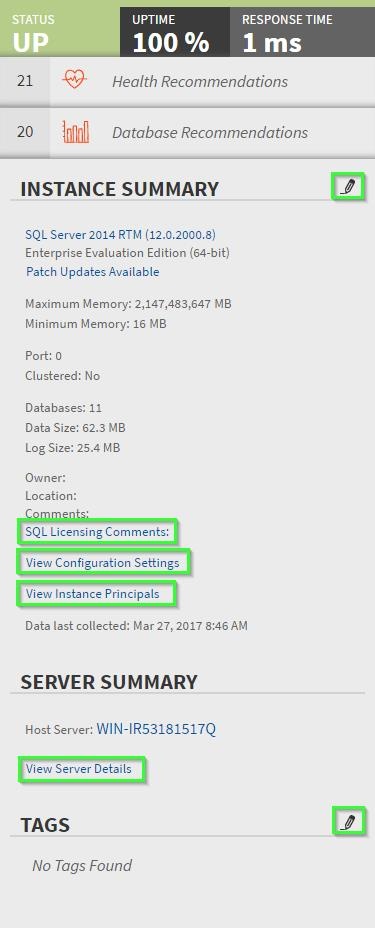
Instance summary and status
On the right side of the instance details Instance Details view, you can see a section that provides general information for your instance.
On this sidebar, you can see the following information for this instance:
- The status of the instance (up or down).
- The uptime up time and response time status.
- The number of health check recommendations for this instance.The
- number of database recommendations for this instance.
- A summary of the instance details , with information about its including:
- Microsoft SQL Server version
- maximum
- and minimum memory
- port information
- whether the instance is clustered
- number of databases
- data size
- log size
- owner
- location
- comments
- custom inventory fields (click the pencil icon to change the field values. For more information, see How to manage custom inventory fields.)
- configuration settings (for more information go to View configuration settings)
- a list of Users and Principals for the currently selected instance, for more information go to Viewing Security Profiles.
- date and time
- of last data collection
- summary of the host machine details including:
- host machine name
- applied inventory tags (click the pencil icon to access the Inventory Tag information)
- server details (for more information go to Computer Details)
- associated tags (click The tags that this instance belongs to. Click the pencil icon to access the Managing tags for an instance window where you can add new tags or choose other tags for this instance. )
| Info |
|---|
Take into account that SQL Inventory Manager rounds off data so there may be minor discrepancies between the size data displayed in the Instance Summary and Databases section of the Instance Details view. |
| Tip | ||
|---|---|---|
| ||
Click the pencil icon next to the Instance Summary title and you can access the options for editing your instance properties such as owner, location, comments, and credentials. For more information, refer to Edit instance properties. |
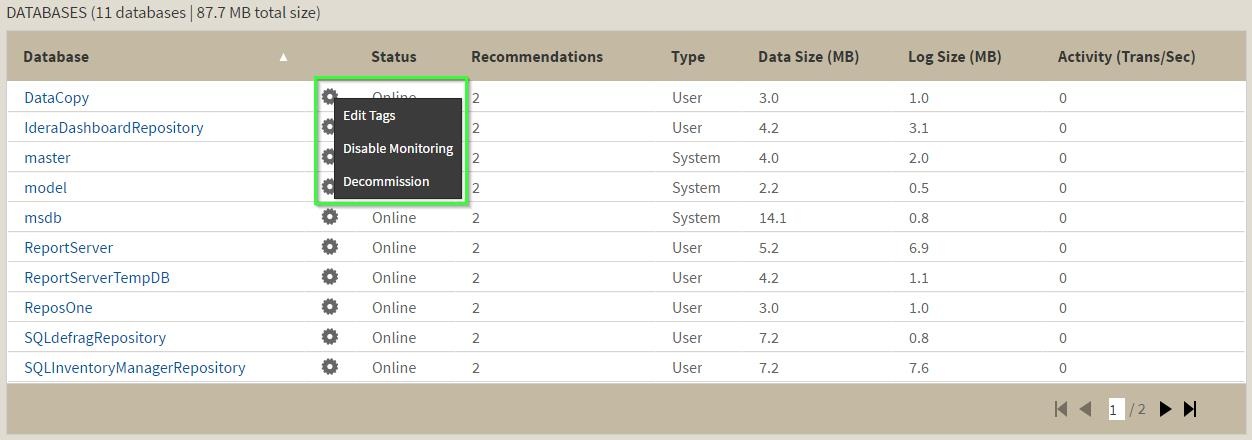
Instance Databases
At the bottom section of the instance details Instance Details view, SQL Inventory Manager displays a list of all databases available as well as any decommissioned databases on this instance.
This The Databases list shows you information about the status, number of recommendations, type, data size, log size, and activity for each database.
There is a Click the gear icon next to the database name , click this icon to select any one of these the following options:
- Edit Tags - Access your database tags to add or assign new tags to your selected database.
- Disable Monitoring - of the selected databaseTemporarily stop monitoring of this instance. When you choose this option, you will no longer receive alert notifications from this database until you enable its monitoring again.
- Decommission Edit Tags - select this option to access your database tags. You can add or assign new tags to your selected database. - Allows you to decommission this database. Decommissioned databases appear below the Databases list.
If you click directly on the Database database name, you can access the Database Details. For more information on what is available on these details, go to Viewing Database Details.
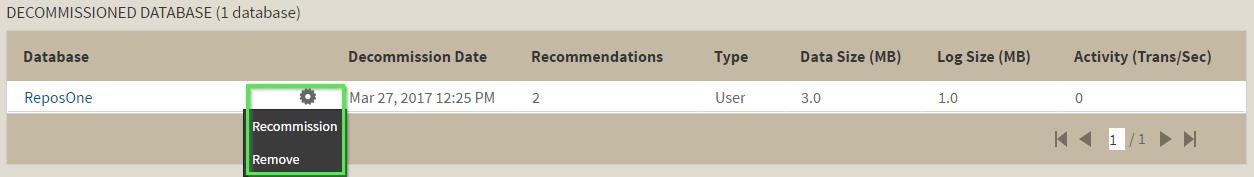
The Decommissioned Databases list shows you information about the decommission date, recommendations, database type, size, and activity for each database.
Click the gear icon next to the decommissioned database to select one of the following options:
...
Need more help? Search the Idera Customer Support Portal.
- - Returns the database to a monitored state.
- Remove - Removes the database from the instance.
If you click directly on the database name, you can access the Database Details. for more information on what is available on these details, go to Viewing Database Details.
...