You can specify a the number of console options in the Console Options window that affect overall product behavior. To access Access the Console Options window , select Tools by selecting  Image Added > Console Options from the SQL Diagnostic Manager Console toolbar.
The following tabs are available on the Console Options window:
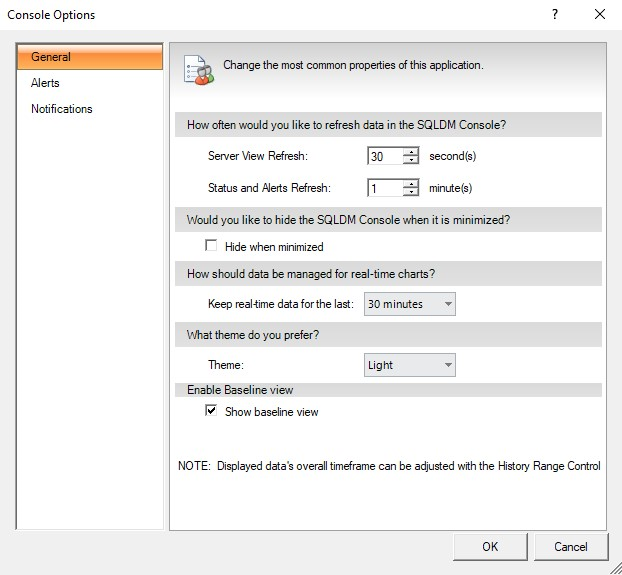 Image Added
 Image Removed
General
The General tab allows you to set how often the console refreshes data, hide the Console when minimized, select how SQL Diagnostic Manager manages chart data, choose what colors you want SQL Diagnostic Manager to use, and enable the Baseline view.
Alerts
The Alerts tab allows you to limit the number of historical alerts displayed in the Alerts view, which can improve the view's performance of the view when there is a large number of are many alerts.
Notifications
The Notifications tab allows you to configure how SQL Diagnostic Manager notifies you when alert data crosses a threshold.