Page History
SQL Diagnostic Manager, displays a wide variety of the most common SQL Server and Operating System performance metrics, by default,. In addition to providing these common metrics, custom counters provide the ability to add additional performance metrics to the SQL Diagnostic Manager Console used for historical trending, on-demand monitoring, and schedule refresh alerting.
| Tip | ||||||
|---|---|---|---|---|---|---|
| ||||||
In the
|
...
- All Windows System Counters, including all Perfmon and WMI counters
- Any SQL Server System Counter stored in the sysperfinfo system table
- Any numerical value you would like to return from a custom SQL script
- VM and host server performance counters accessible through the host Server
- Azure Server System Counter to monitor counters that are collected using API supplied by Azure.
...
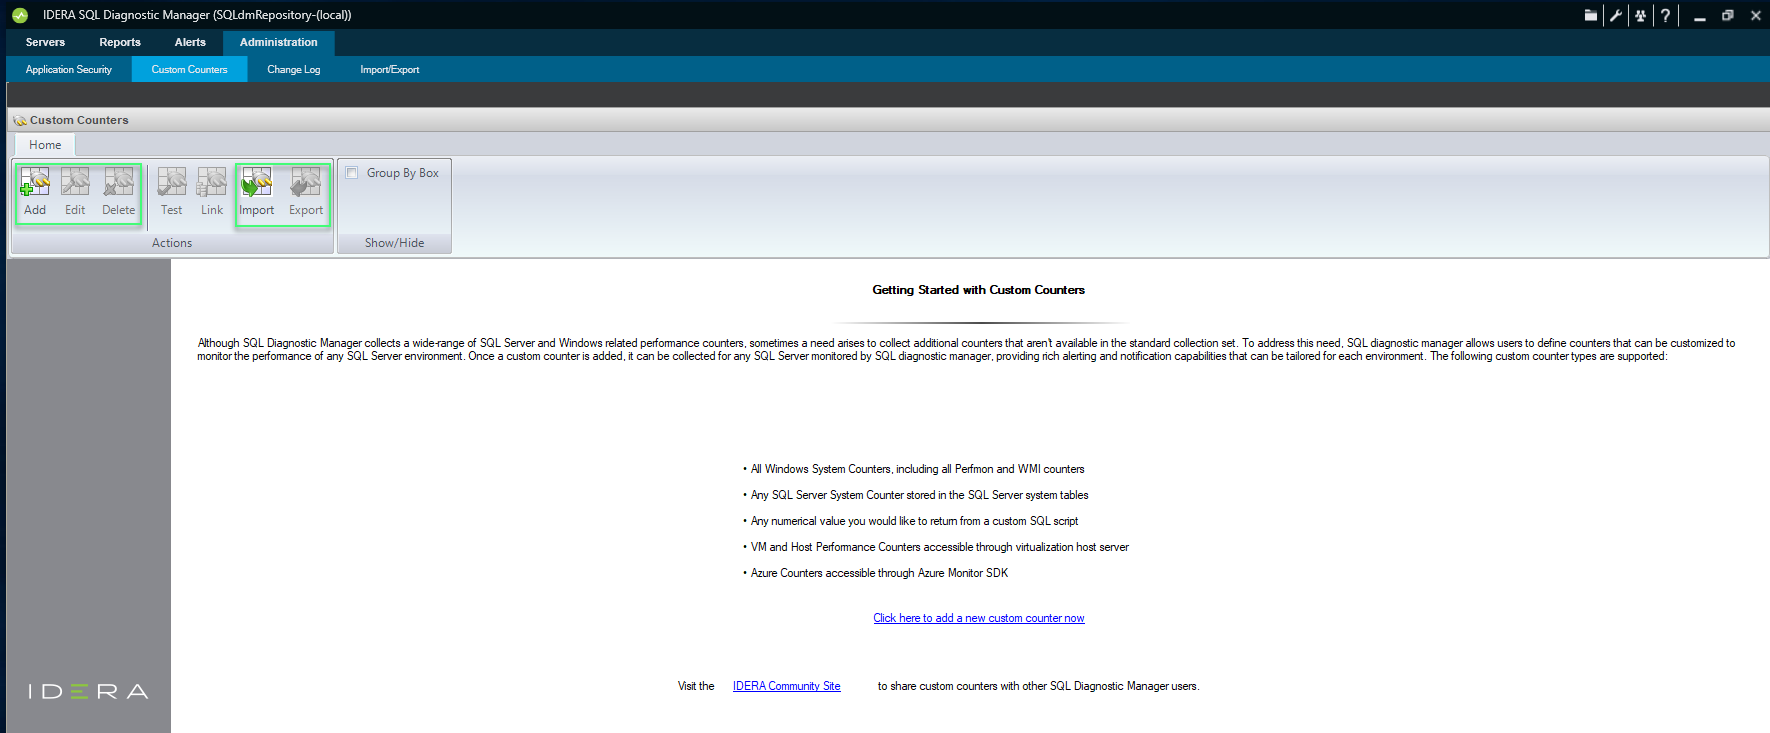
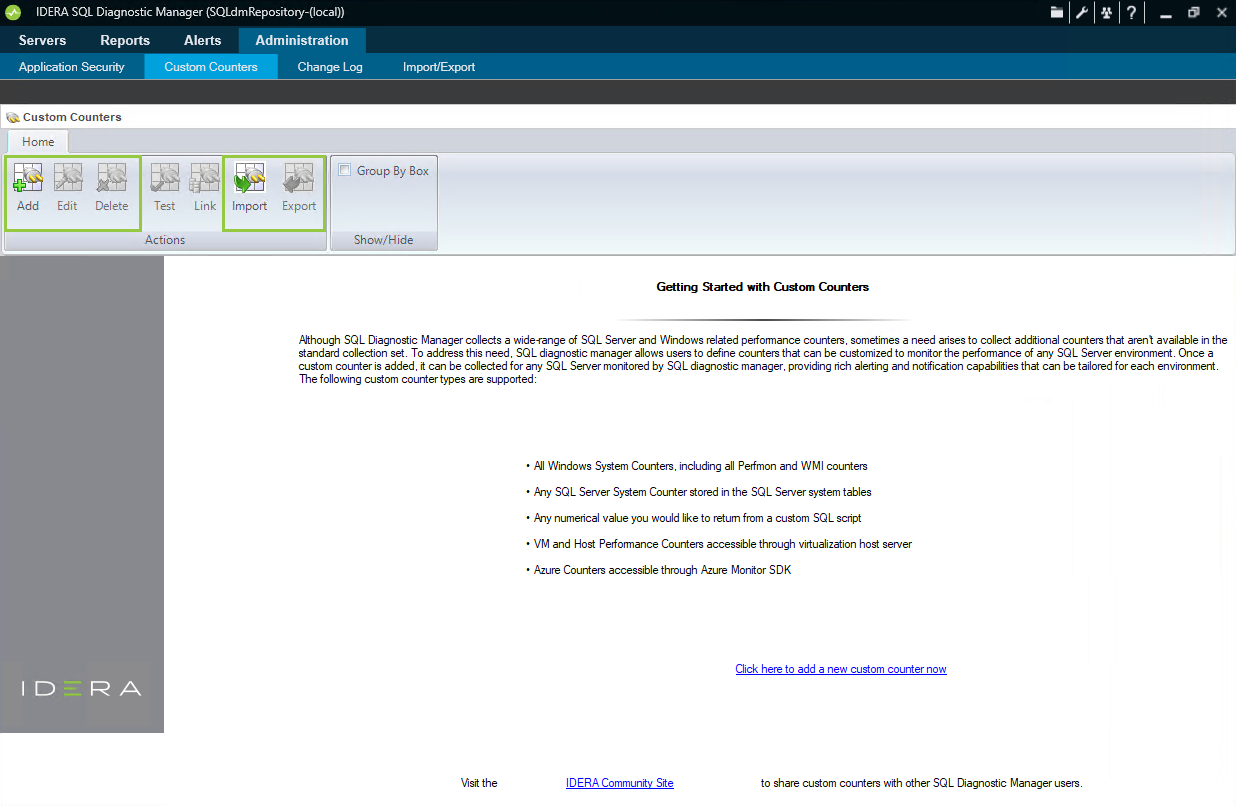
To open the Custom Counters view, click Administration > Administration > Custom Counters.
Create a custom counter
To add a custom counter:
- Select the Administration the Administration tab and click Custom Counters.
- Click Add, to to create a Custom Counter.
- Click Next on the Add Custom Counter wizard Welcome page.
- Select a counter type, and click Next.
- Select the counter you want to monitor, and click Next.
- Select the counter calculation type and scale factor, and click Next.
- Type a name for the custom counter, select a Category, add a Description, and click Next.
- Configure your alert settings related to the new custom counter, and click Next.
- Click Finish.
...
Use custom SQL scripts to monitor metrics that are not connected to the system or SQL counters, under-utilized SQL 2005 DMVs, or metrics that are very specific to your environment, such as row count for a production table.
...
Your new custom counters appear in the Alert Configuration and the Default Alert Configuration windows in the Custom category. You can edit the alert thresholds , and even decide whether you want an alert associated with the new counter.
...
The Server Details view lists all the metrics monitored by SQL Diagnostic Manager, including all your new custom counters. You can filter this view to display only your custom counters by selecting the Custom Counters radio - button in the Filter ribbon. You can access this window by selecting details on the Server view or by double-clicking Custom Counters in the Servers tree.
...
SQL Diagnostic Manager provides a list of all your custom counters in the Custom Counters table on the Administration window. In addition to viewing a list of custom counters, you can add a new counter, edit a counter, delete a counter, test a counter, or link a counter to a an SQL Server instance for monitoring.
...