Page History
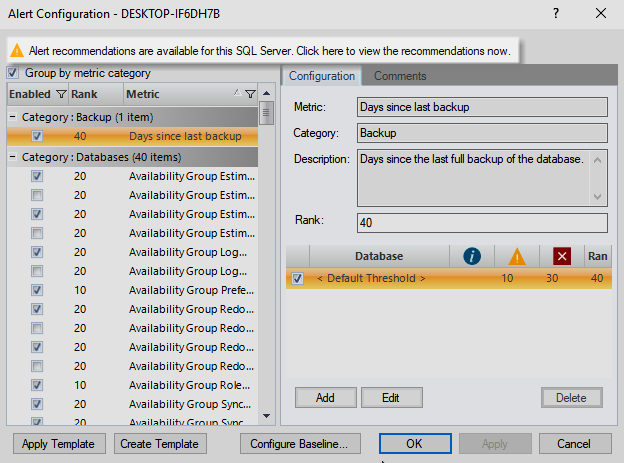
SQL Diagnostic Manager provides you alert recommendations to help eliminate false alerts, such as alerts for metrics that fit within the typical performance of your server. You can view these recommendations on the Alert Recommendations window. The Alert Recommendations window is accessed by clicking the "Alert recommendations are available for this SQL ServerSQL Server. Click here to view the recommendations now." text at the top of the Alert Configuration window. This text appears after collections have occurred in which alert thresholds fall within the baseline range.
The recommendations presented are calculated using your baseline and adding either 20% or 30% over the standard deviation. To edit the percentage over the standard deviation used, select the Options button at the bottom of the Alert Recommendations window.
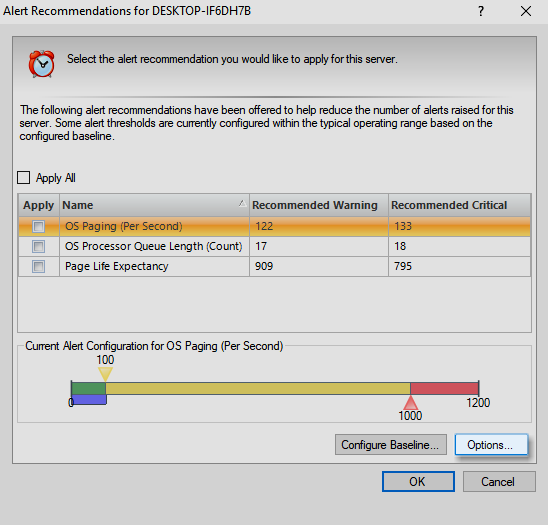
To use the Alert Recommendations window:
- Select the first metric in the Alert Recommendations list. The current alert configuration appears at the bottom of the window so that you can easily compare that against the recommended warning and recommended critical columns.
- If you agree with the recommendations and want to apply them to your metric, check the Apply box.
- Click OK.
...