The Baseline Configuration tab of the Monitored SQL Server Properties window allows you to configure your server baseline options. SQL Diagnostic Manager calculates a baseline out of a pool of collected data based on the selected period and collection interval , and is represented by mean, standard deviation, minimum, maximum, and count statistics.
...
...
You can access the Baseline Configuration tab of the Monitor SQL Server Properties window by right-clicking the appropriate monitored SQL Server instance, and then selecting Baseline Configuration.
Select a baseline period
The baseline period you specify should represent a typical operation of the monitored SQL Server instances to which this baseline applies.
...
SQL Diagnostic Manager allows you to add and schedule multiple baseline periods in addition to the default one. Open the Add baseline window by clicking the Manage Baseline button. For more information, see Schedule multiple baselines.
Apply the baseline to more than one instance
...
- Click Apply Baseline Configuration to display the Select Monitored SQL Server Instances dialog.
 Image Removed
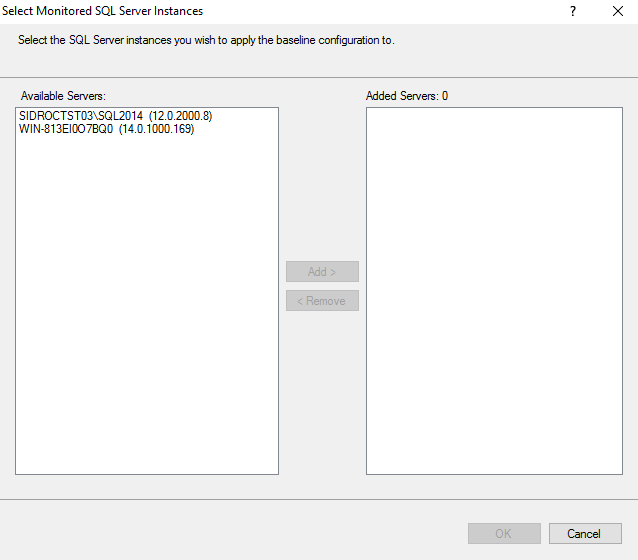 Image Added
 - Select the appropriate instances from the Available Servers list, and then click Add > to move them to the Added Servers list.
- Click OK to confirm your selection and allow SQL Diagnostic Manager to apply this configuration to other instances.
...
- Available Memory
- Batches Per Second
- Blocked Sessions
- Buffer Cache Hit Ratio
- Buffer Cache Size
- Checkpoint Writes Per Second
- Client Computers
- Data File Count
- Data File Space Allocated
- Data File Space Used
- Data File Space Used (Percent)
- Database Count
- Disk Queue Length
- Disk Time (Percent)
- Distribution Latency
- Host CPU Usage
- Host CPU Usage MHz
- Host Disk Device Latency
- Host Disk Kernel Latency
- Host Disk Queue Latency
- Host Disk Read
- Host Disk Total Latency
- Host Disk Usage
- Host Disk Write
- Host Memory Swap In Rate
- Host Memory Swap Out Rate
- Host Memory Active
- Host Memory Ballooned
- Host Memory Consumed
- Host Memory Granted
- Host Memory Usage
- Host Net Received
- Host Net Transmitted
- Host Net Usage
- Full Scans Per Second
- Lazy Writer Writes Per Second
- Lock Waits Per Second
- Log File Count
- Log File Space Allocated
- Log File Space Used
- Log File Space Used (Percent)
- Log Flushes Per Second
- Logins Per Second
- Oldest Open Transaction (Minutes)
- Open Transactions
- OS CPU Privileged Activity
- OS CPU User Time
- OS Memory Used (Percent)
- OS Total Processor Activity
- Packet Errors Per Second
- Packets Received Per Second
- Packets Sent Per Second
- Page Life Expectancy
- Page Lookups Per Second
- Page Reads Per Second
- Page Splits Per Second
- Page Writes Per Second
- Pages Per Second
- Physical Memory
- Procedure Cache Hit Ratio
- Procedure Cache Size
- Processor Queue Length
- Read Ahead Pages Per Second
- Replication Latency (Seconds)
- Replication Subscribed
- Response Time
- SQL Compilations Per Second
- SQL CPU Activity
- SQL Memory Allocated
- SQL Memory Used
- SQL Recompilations Per Second
- System Processes
- System Processes Consuming CPU
- Table Lock Escalations
- Tempdb GAM Wait Time Milliseconds
- Tempdb PFS Wait Time Milliseconds
- Tempdb SGAM Wait Time Milliseconds
- Tempdb Size
- Tempdb Size Percent
- Undistributed Transactions
- Unsubscribed Transactions
- Used Memory (Percent)
- User Connections (Percent)
- User Processes
- User Processes Consuming CPU
- Version Store Generation
- Version Store Size
- VM CPU Ready
- VM CPU Swap Wait
- VM CPU Usage
- VM CPU Usage MHz
- VM Disk Read
- VM Disk Usage
- VM Disk Write
- VM Memory Active
- VM Memory Ballooned
- VM Memory Consumed
- VM memory Granted
- VM Memory Swap In Wait
- VM Memory Swap Out Rate
- VM Memory Swapped
- VM Memory Usage
- VM Net Received
- VM Net Transmitted
- VM Net Usage
- Workfiles Created Per Second
- Worktables Created Per Second

