Page History
The Alerting option from the SQL Compliance Manager Menu allows users to configure their preferred email and SNMP settings, as well as to groom undesired alerts on your SQL Servers.
Available actions
Configure Email Settings
The Configure Email Settings window allows you to configure IDERA SQL Compliance Manager to connect to your mail server. This configuration is required to send alert email notifications. For more information, see Configure Email Settings window.
Configure SNMP Settings
The SNMP Configuration window allows you to specify the server address, port number, and community name of the network management console that you want to receive a IDERA SQL Compliance Manager alert notification as SNMP Trap messages. For more information, see SNMP Configuration window.
Groom Alerts Now
The Groom Alerts Now window allows you to groom alert messages currently stored in the Repository databases. Grooming permanently deletes any alert message that is older than the age limit you specify. For more information, see Groom Alerts Now window.
Available fields
Configure Email Settings
The Configure Email Settings window allows you to configure IDERA SQL Compliance Manager to connect to your mail server. This configuration is required to send alert email notifications. For more information, see Configure Email Settings window.
Configure SNMP Settings
The SNMP Configuration window allows you to specify the server address, port number, and community name of the network management console that you want to receive a IDERA SQL Compliance Manager alert notification as SNMP Trap messages. For more information, see SNMP Configuration window.
Groom Alerts Now
The Groom Alerts Now window allows you to groom alert messages currently stored in the Repository databases. Grooming permanently deletes any alert message that is older than the age limit you specify. For more information, see Groom Alerts Now window.
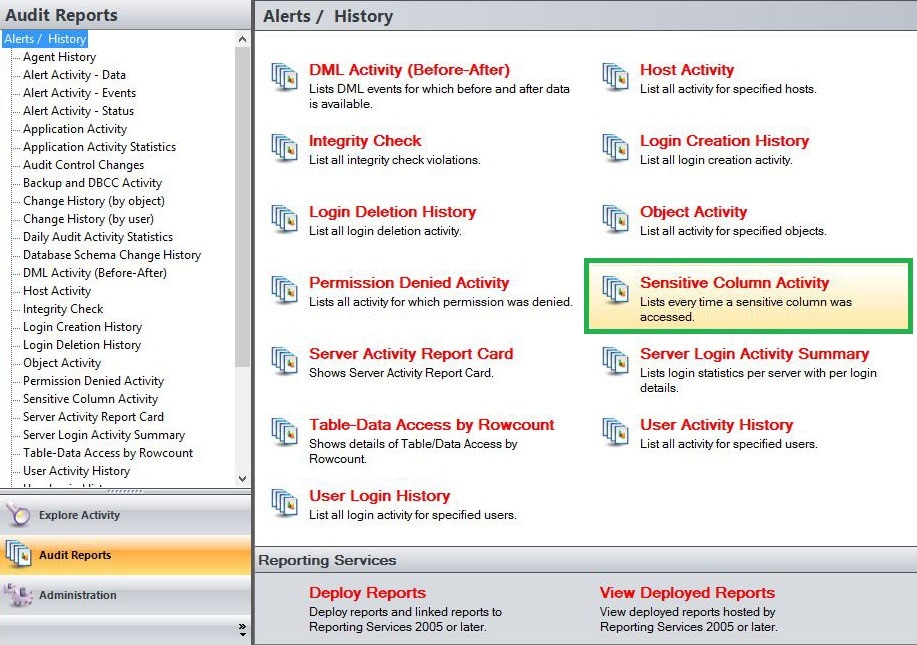
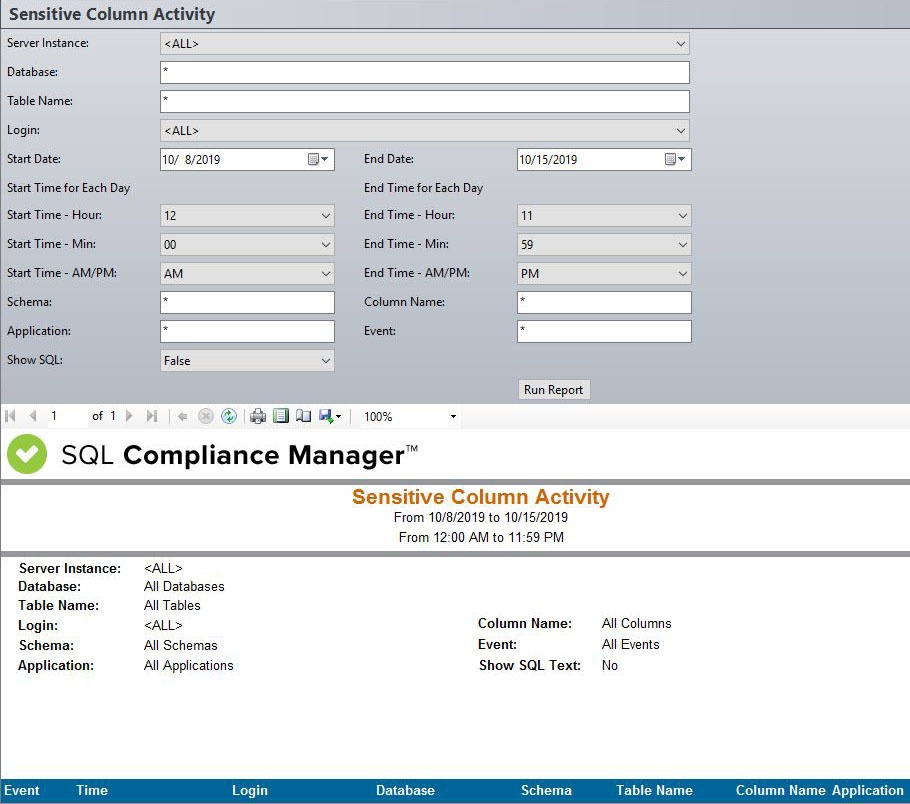
Sensitive Column Activity Report lists every time a sensitive column is accessed. The report lists all SELECT events that were initiated by applications to read specific columns that contain sensitive data. Use this report to audit columns that require high security or contain sensitive data.
A filter can include a list of wildcards, separated by commas, where a wildcard is a string, which may contain asterisks. The following parameters are specific to the selected report and enable you to filter the data to include in the report.
Available actions
Server Instance
Allows you to select a registered instance on which you want to report. Select ALL to report on all instances.
Databases
Allows you to select or type the name of one or more databases on which you want to report.
Table Name
Allows you to select or type the name of one or more table names on which you want to report.
Login
Allows you to select the login from the drop down list of available logins. Select ALL to report on all logins.
Start Date
Allows you to select the start date for the range from which you want to report.
End Date
Allows you to select the end date for the range from which you want to report.
Start Time - Hour
Allows you to select the exact starting hour of the day for the range from which you want to report.
Start Time - Min
Allows you to select the exact starting minute of the day for the range from which you want to report.
Start Time - AM/PM
Select between AM or PM from the drop down list to configure the Start Time for Each Day range from which you want to report.
End Time - Hour
Allows you to select the exact ending hour of the day for the range from which you want to report.
End Time - Min
Allows you to select the exact ending minute of the day for the range from which you want to report.
End Time - AM/PM
Select between AM or PM from the drop down list to configure the End Time for Each Day range from which you want to report.
Schema
Allows you to type the name of the schema on which you want to report.
Column Name
Allows you to type the column names of one or more columns on which you want to report.
Application
Allows you to type the name of one or more applications on which you want to report.
Event
Allows you to type the name of one or more events on which you want to report.
Show SQL
Select between True or False from the drop down menu to filter the report by SQL Text.
Run Report
Click this button to Run the report.
Default columns
Event
The Event column indicates the type of event captured.
Time
The Time column displays the date and time when the event was captured.
Login
The Login column displays the login name of the user who performed the event.
Database
The Database column displays the name of the database where the event was captured.
Schema
The Schema column displays the name of the event´s schema.
Table Name
The Table Name column displays the name of the table where the event was captured.
Column Name
The Column Name column displays the name of the column where event was captured.
Application
The Application column displays the name of the application used to capture the event.
...