Page History
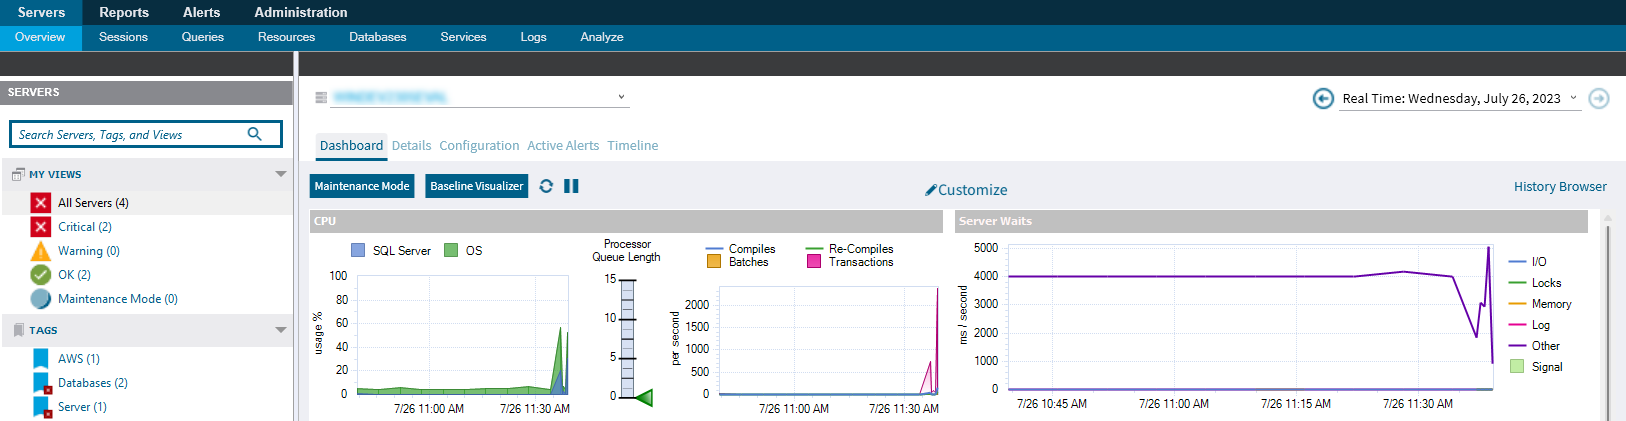
Throughout the day, your monitored SQL Server instances can go through a number of several situations including triggered alerts requiring immediate attention. Some events result in multiple alerts, each needing you to keep a close eye on them as a resolution is put into place. To help you monitor your SQL Server instances, SQL Diagnostic Manager provides a default Dashboard view that includes commonly - monitored metrics for the selected SQL Server instance.
You can improve the Dashboard view by customizing your view to include those panels most important to you. A customized Dashboard view can help you keep your monitored SQL Server instances from triggering alerts by providing you with real-time coverage of crucial metrics.
...
Note that you can use the same panel more than once in your Dashboard design. Because some panels in the Panel Gallery provide drop-down selections for you to select metrics or other filters, you can use the same panel more than once in your Dashboard. This feature is handy when using panels such as the Databases panel because it allows you to have one Databases panel displaying a selected metric and another Databases panel displaying a different metric. You can so do the same with the Disk panel to view the same metrics for different disks at the same time.
...
- Select the appropriate SQL Server instance from the Servers sidebar.
- Click Customize, and notice that you are now in the Customize Dashboard screen.
- If you want to change the number of panels to display in your view, click Select Layout, and select the number of columns and rows.
- Using a drag-and-drop method, move the panels you want to include from the Panel Gallery to the location within the view where you want that panel to reside. You can place the same panel more than once in your view. This feature is important on panels that allow you to select different metrics, such as the Databases panel which offers different measurements per second.
- Click Close Designer once you select and move panels to where you want them to reside.
- On the confirmation message, click Yes to use this design again or apply it to additional SQL Server instances, or click No to use this design for only this session of the SQL Diagnostic Manager Management Console. For additional information about saving a dashboard design, see Save a dashboard design.