Page History
...
- Select the type of server
- Associate tags with an instance
- Select a diagnostic data collection interval
- Assign a friendly name to your SQL Server instance
- Collect extended session data
- Assign data collection credentials
- Select encryption options
- Configure read-only connections
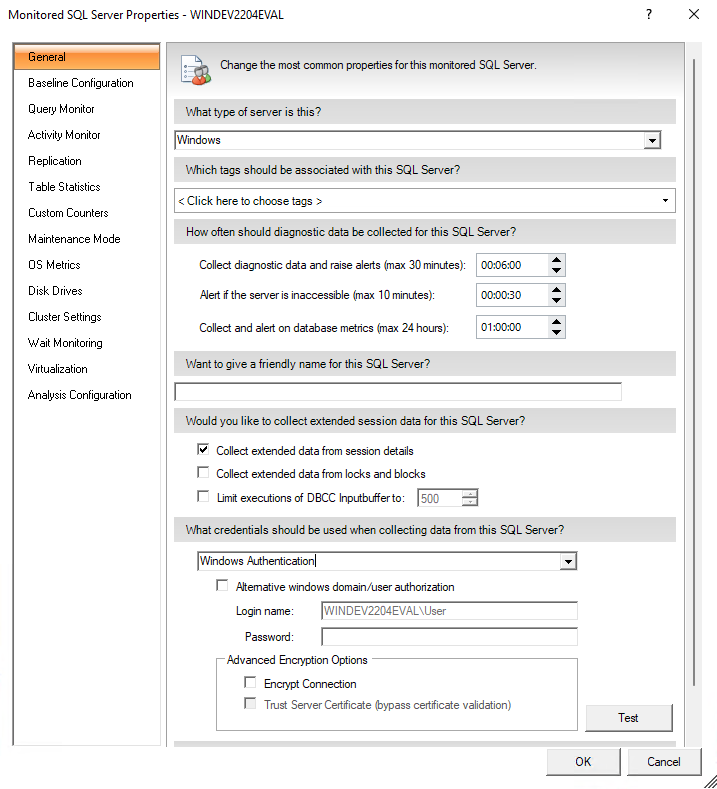
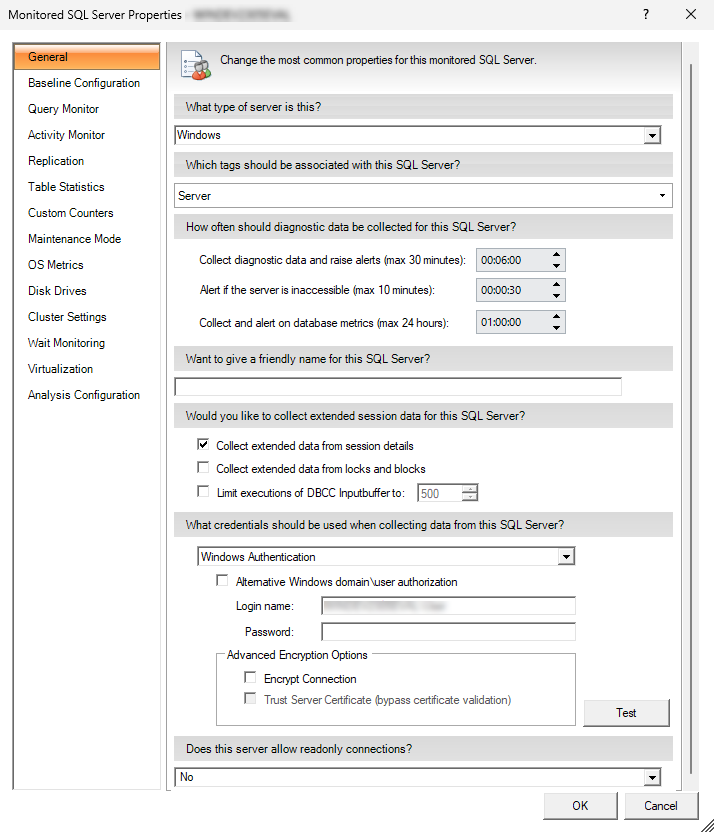
Access the General tab
You can access the General tab of the Monitor SQL Server Properties window by right-clicking the appropriate monitored SQL Server instance, and then selecting Properties.
| Anchor | ||||
|---|---|---|---|---|
|
...
The interval between times that the SQLDM Collection Service collects diagnostic data and raises the associated alerts. Lower values cause SQL Diagnostic Manager to raise alerts more quickly , but also cause more frequent refreshes, which increases your monitoring overhead.
...
The interval between times that the SQL Diagnostic Manager Collection Service collects database space-related data and raises the associated alerts. Lower values cause SQL Diagnostic Manager to raise alerts more quickly , but also cause more frequent refreshes, which increases your monitoring overhead. In environments with a large number of databases whose sizes do not change rapidly, setting the database data collection to a long interval can greatly reduce the monitoring footprint.
...
If your goal with this data collection is to identify broad trends and alert alerts on critical downtime, then a longer refresh interval is appropriate. If you are closely monitoring your SQL Server SQL Server instance for minute-by-minute changes, use a shorter duration.
...
SQL Diagnostic Manager averages most metrics over the timeframe between collections. More - frequent data collection causes increased movement in averages because of short-duration events. For example, a 15-second CPU spike has a greater effect on a one-minute refresh than on a six-minute refresh. You can use alert smoothing to reduce the impact of data spikes on a per-alert basis.
...
SQL Diagnostic Manager allows you to assign a friendly name to your monitored SQL Server instance that is meaningful to you and easy to identify. SQL SQL Diagnostic Manager displays the friendly name in name in the server tree of the desktop client and in the web console.
Anchor GPextendedsession GPextendedsession
Collect extended session data
| GPextendedsession | |
| GPextendedsession |
...
SQL Diagnostic Manager allows you to designate encryption methods used to encrypt data between the Collection Service and the monitored SQL Server SQL Server instance. You can choose to use SSL or SSL with a Trust Service Certificate.
...
This option sets a flag in the connection properties that is are used when the collection service connects to a monitored server that specifies that SSL (Secure Sockets Layer) is used to encrypt the data between the collection service and the monitored SQL Server SQL Server instance. For this option to work correctly, configure the monitored SQL Server SQL Server instance to support encryption.
...
This option is available only when the Encrypt Connection (SSL) is selected. This option allows you to skip the certificate validation when a SQL Server SQL Server instance establishes a connection. If SSL on the monitored SQL Server SQL Server instance is not configured to use a certificate that the collection service trusts, the connection is rejected unless the Trust Server Certificate option is selected.
Anchor ReadOnly ReadOnly
Configure read-only connections
| ReadOnly | |
| ReadOnly |
SQL Diagnostic Manager allows you to set up read-only connections for a specific instance.