Page History
...
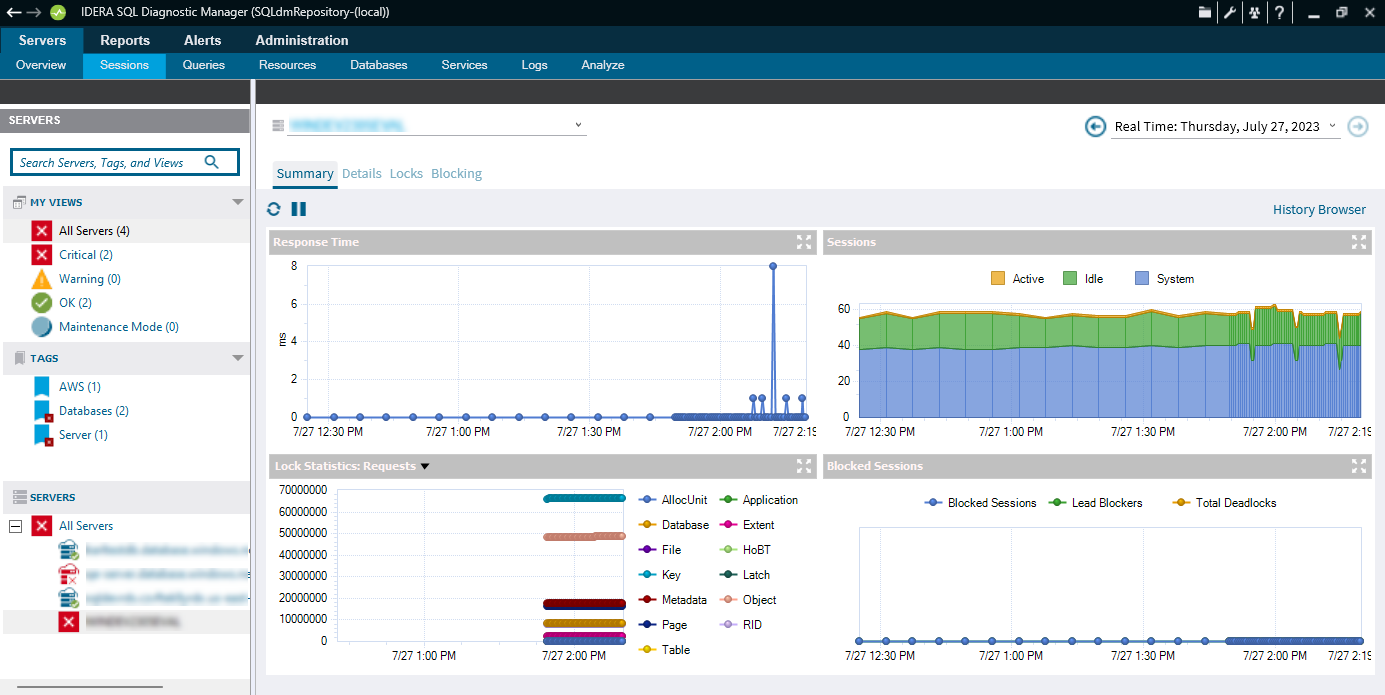
- Summary: You can view charts for each Sessions statistic, the following charts are displayed in the Summary tab:
- Response Time
- Sessions
- Lock Statistics: Average Wait Time, Deadlocks, Requests, Timeouts, Waits, and Wait Time
- Blocked Sessions
- Details: Allows you to create charts with the specific data items you need.
- Locks: Allows you to create charts based on each lock present on your SQL Server.
- Blocking: Allows you to create charts specific to all the Blocking sessions.
The Sessions tab provides the following options:
...