Page History
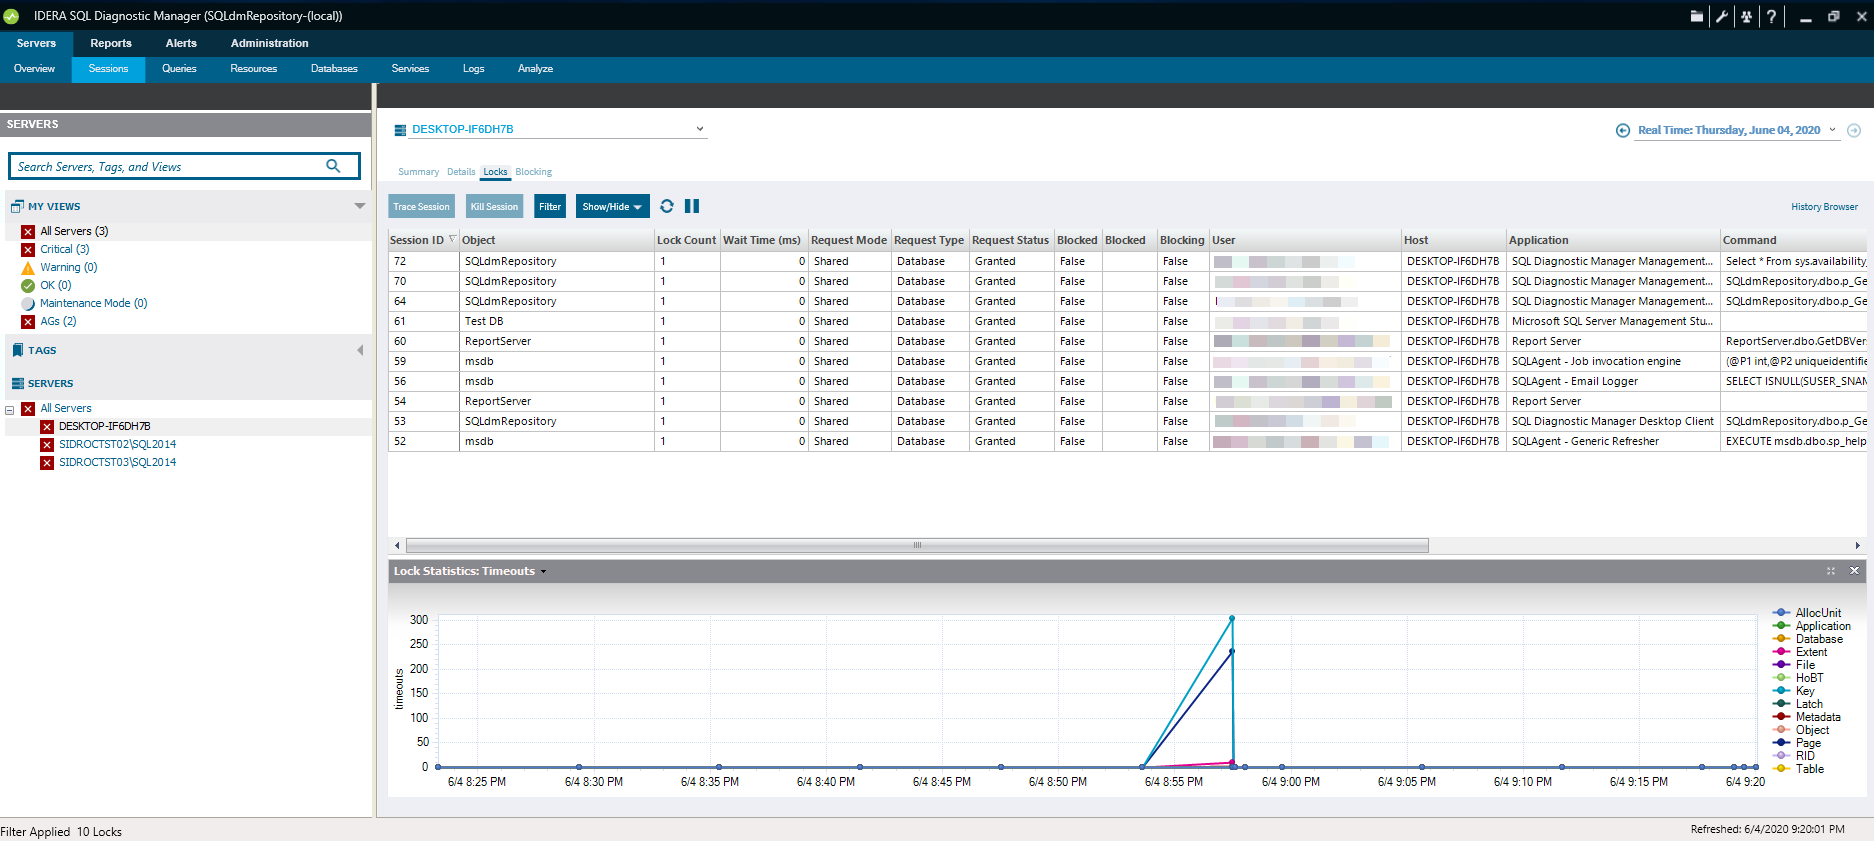
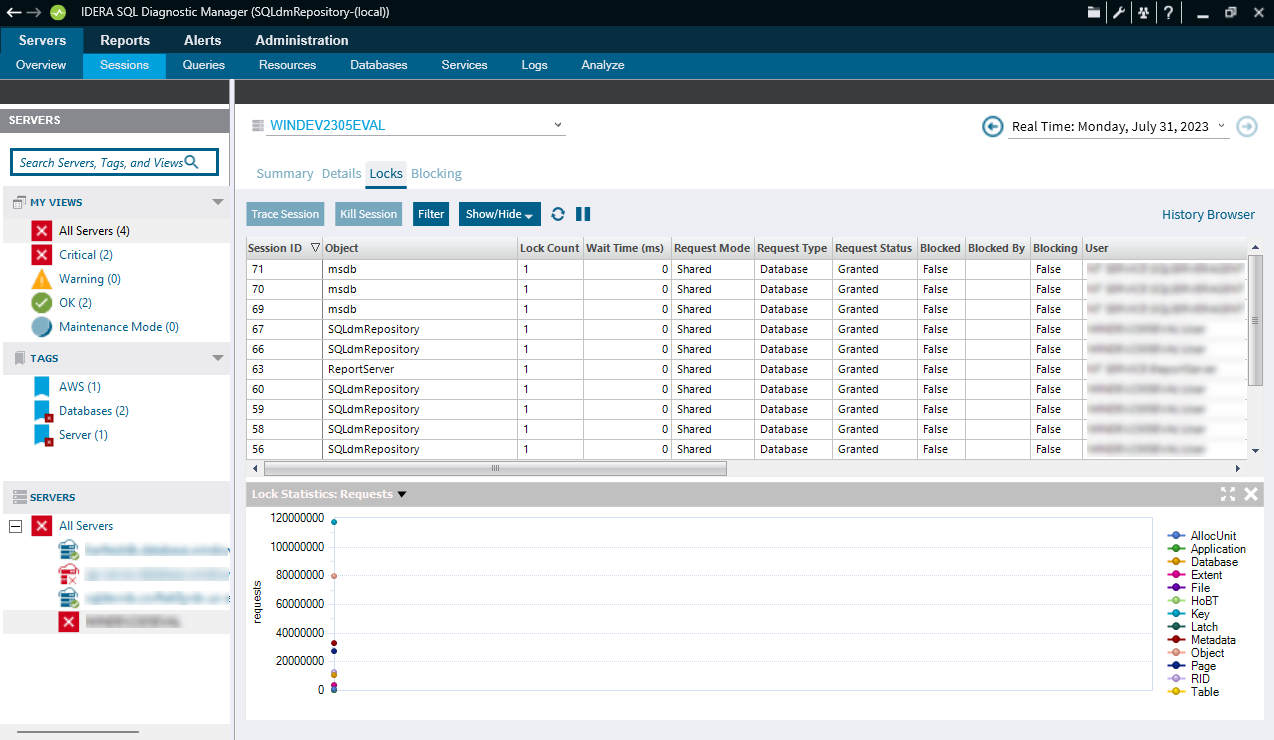
On the The Locked Sessions view , you can see shows which problem locks are causing data availability problems and unacceptable responses. By combining Combining the information provided on the Problem Locks view (including the type of Lock) with the Lock Statistics: Waits chart on the Sessions Summary tab, you can pinpoint, correct, or reschedule automated applications that cause extensive row, table, or database locking.
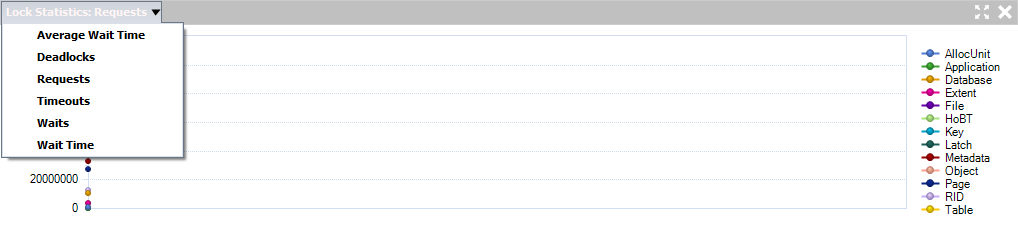
Use the drop-down list in the chart title to select charts that include:
- Average Wait Time
- Deadlocks
- Requests
- Timeouts
- Waits
- Wait Time information
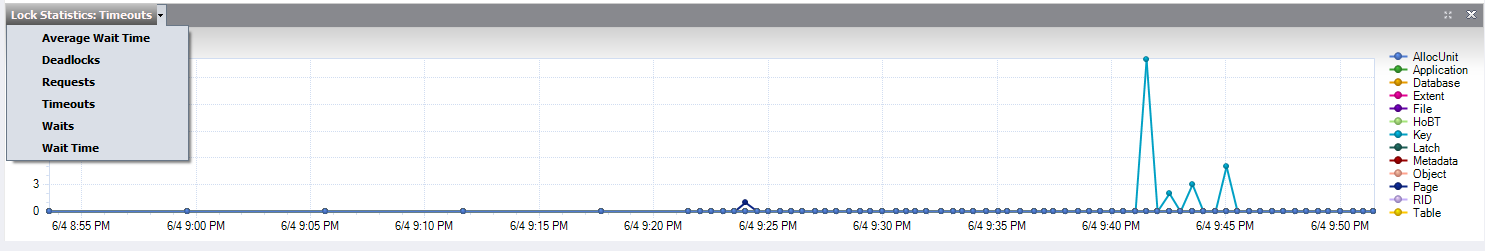
Right-click any of these charts and either print, save as an image, or export them to Microsoft Excel. In addition, you can select Toolbar for advanced customization options such as changing the chart color scheme and the type of chart shown.
...
You can open the Locks view of the SQL Diagnostic Manager Sessions tab by selecting the appropriate SQL Server inst ance, instance and clicking Sessions > Locks.
...
Represents a lock on a table.