Page History
...
You can select to collect non-query activities activity data using Extended Events (Use Extended Events radio button) or SQL Trace (Use SQL Trace radio button). For instances running SQL Server 2012 or higher, the Activity Monitor uses by default Extended Events. First introduced in SQL Server 2008, Extended Events provide a new mechanism to capture information about events inside the Database Engine and diagnose performance problems. This functionality is highly efficient and lightweight. For more information about using Extended Events, see the Microsoft document, Extended Events.
| Note |
|---|
To capture non-query activites activities for monitored pre-SQL Server 2008 instances, enable the SQL Trace collection option. Note that enabling this option can degrade performance on your SQL Server. |
...
SQL Server 2005+ includes a new SQL Server Profiler event, the Blocked Process report. This event helps identify blocking issues and provides relevant information to solve these issues. In SQL Diagnostic Manager, you can take advantage of this feature by setting the blocked process threshold value according to your needs. To access the Blocked Process Threshold option, enable Capture Blocking (SQL 2005+) in the Activity Monitor window. Note that when this option is enabled, the blocked process threshold value is automatically set to 5 (seconds) but can be modified as desired.
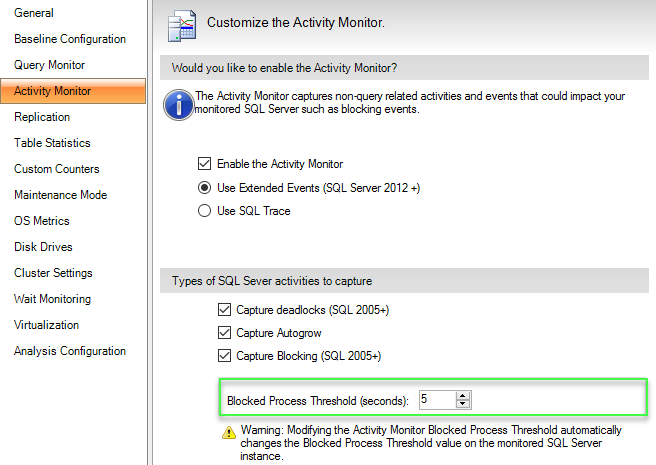
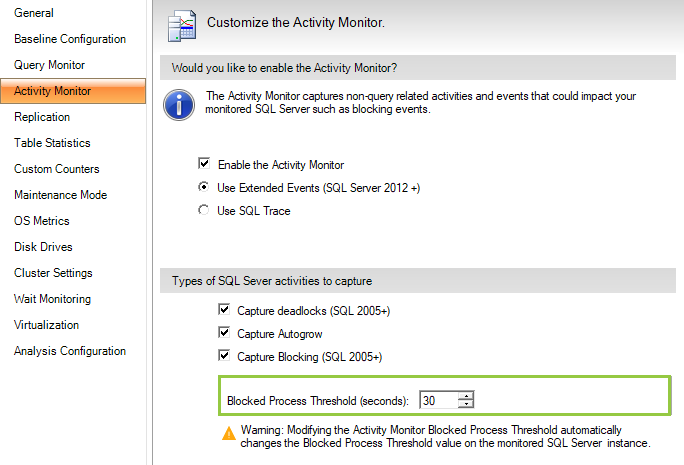
Since collecting information about blocked processes in an SQL server is resource-intensive, IDERA recommends to set setting the blocked process threshold value to at least 5 (seconds) or your deadlock monitor runs constantly. For more information on this topic, see the Microsoft document Newtablink alias Increase or Disable Blocked Process Threshold. url https://technet.microsoft.com/en-us/library/bb402879.aspx
...
You can access the Activity Monitor tab of the Monitored SQL Server SQL Server Properties window by right-clicking the appropriate SQL Server SQL Server instance , and then selecting Properties. Click Activity Monitor when SQL Diagnostic Manager displays the Monitored SQL Server Properties window.
...