Page History
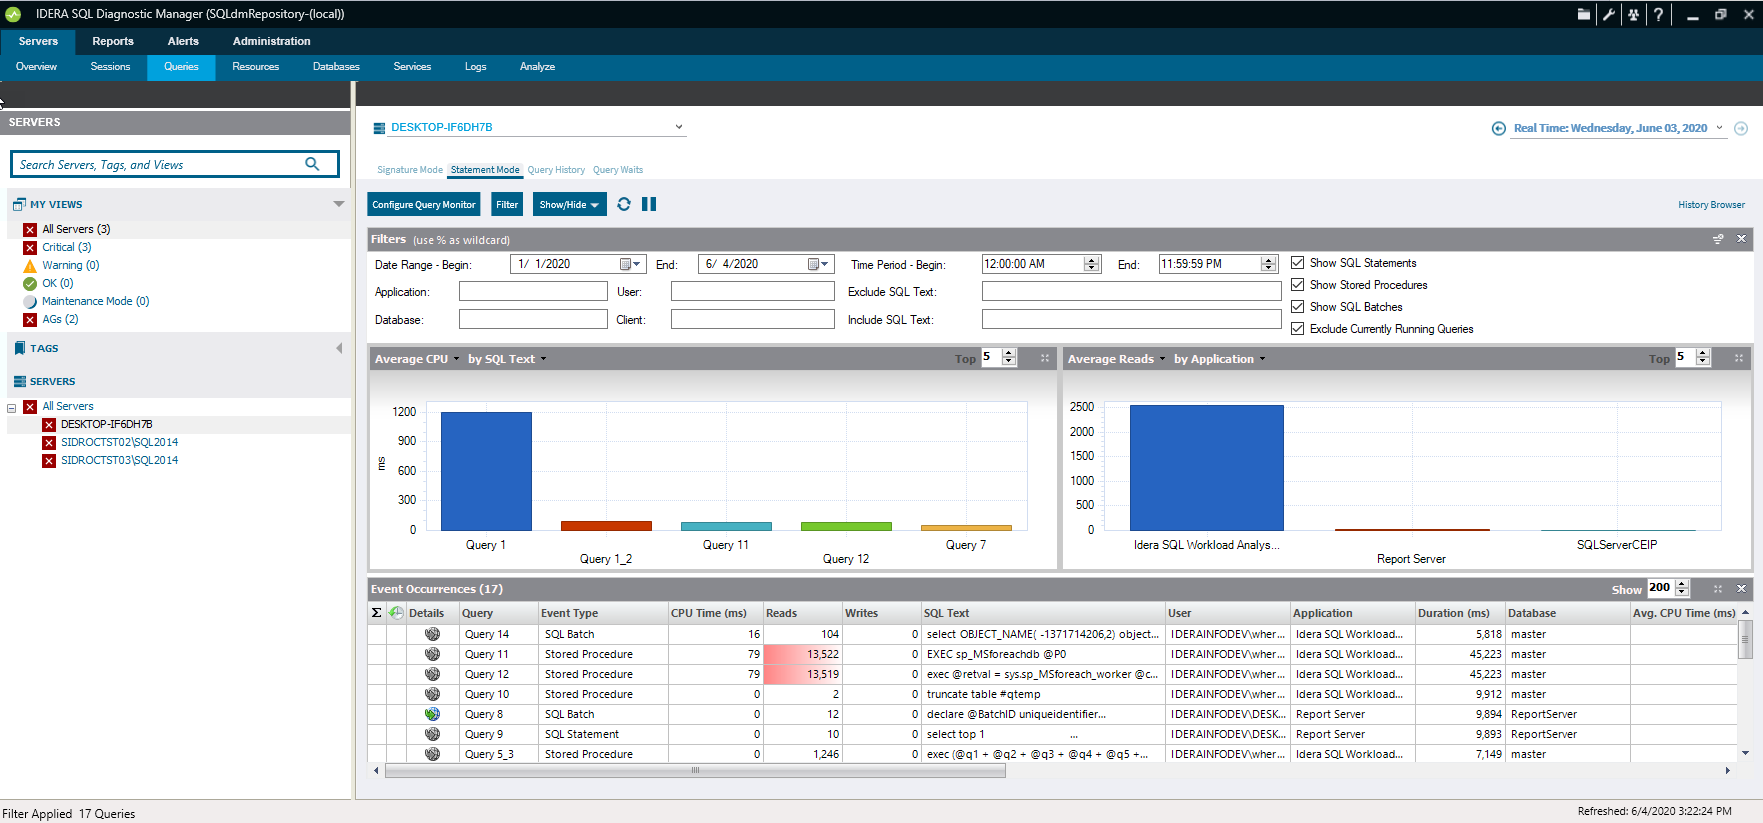
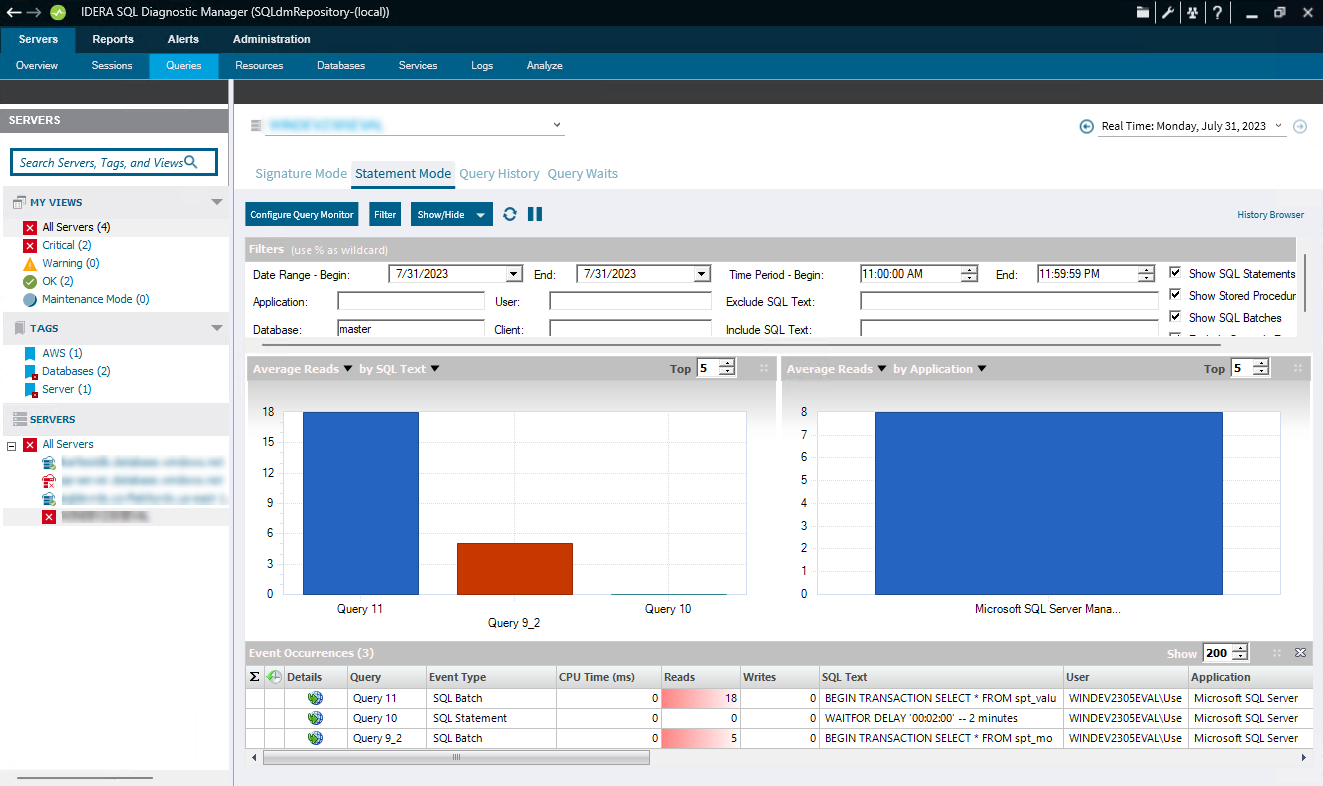
The Statement Mode view includes queries that are presented exactly as they are collected by the Query Monitor Trace.
| Tip |
|---|
If queries appear on the Query Monitor views that you never want to appear, click Configure Query Monitor > Advanced andenter the applications, databases, or SQL text you want to exclude from the Query Monitor collection. |
The Statement Mode view is where you go to drill - down into a specific execution of a particular query. Whereas the signature mode view provides a filtered look at your queries, the Statement Mode view provides all the detail details you may need to diagnose a specific problem with a query. Once you find the problem query, History mode allows you to track the query over time and view trends.
...
| Note |
|---|
In the Signature Mode view, right-click any of the listed queries under the Event Occurrences list and click Show Query Text to open the SQL Text window opens (In this window run a Query Diagnosis and receive a list of performance recommendations). |
| Tip | ||
|---|---|---|
| ||
Red in the column indicates that the data in that row represents 20% or more of the total data displayed in the list, while yellow indicated indicates that the data in the row represents 5%or 5% or more of the total data displayed in the list. |
...