Page History
.RDS/Aurora OS monitoring feature introduced with Monyog-8.1.0. SQL DM for MySQL makes use of the CloudWatch API and uses the different OS metrics available with the API to fetch and display the data. All the RDS/Aurora OS monitors are shown under the monitor group "RDS/Aurora Instance Metrics" in Monitors page and the corresponding charts are available on the Dashboard page. In order to be able to see the OS data, you should first enable system metric for the RDS/Aurora instance
Enabling System Metrics
Go to Servers -> , select Edit server -> , and choose Advanced of the RDS/Aurora instance and enable the system metrics Enable System Metrics. Once enabled, the user should enter the following four parameters:
...
Adding a Custom Object
- Go to Monitors, select RDS/Aurora Instance Metrics, click the
 icon, select Manage RDS/Aurora Objects, and click Add new RDS/Aurora custom object (+) .
 - Enter the name of the CloudWatch Metric which you want to add under the Name field. You can also give the name of the servers comma separated for which you want this metric to be evaluated for.
...
Adding the Monitor
- Go to Monitors, select RDS/Aurora Instance Metrics, click the
 icon, and select Add new monitor.
 - Enter Monitor name and the Monitor group name in which you want to add this new monitor to (use "RDS/Aurora Instance metrics" if you want to add it in this group). Select System as "Type of counter" if you are adding a system metric.
Enter a simple JavaScript function in the Value field using the Cloudwatch metric like:
Code Block function() { return GetAWSMetricVal("NetworkReceiveThroughput"); }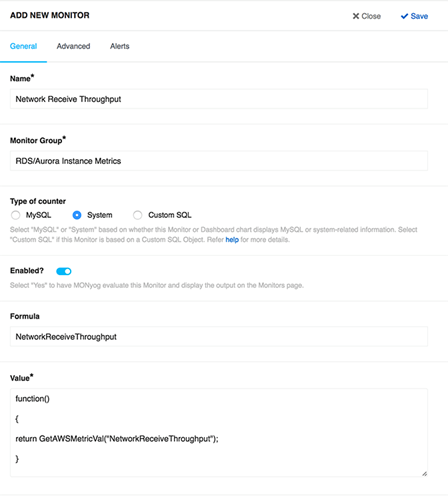
Enabling RDS/Aurora Dashboard charts
Go to Dashboard -> , select Manage Dashboard -> , and Enable the listed RDS/Aurora charts under System Charts. The Dashboard page gives the flexibility to create a dashboard with a particular set of charts, so a user can create a dashboard with only RDS OS metrics charts for ease of monitoring.
...