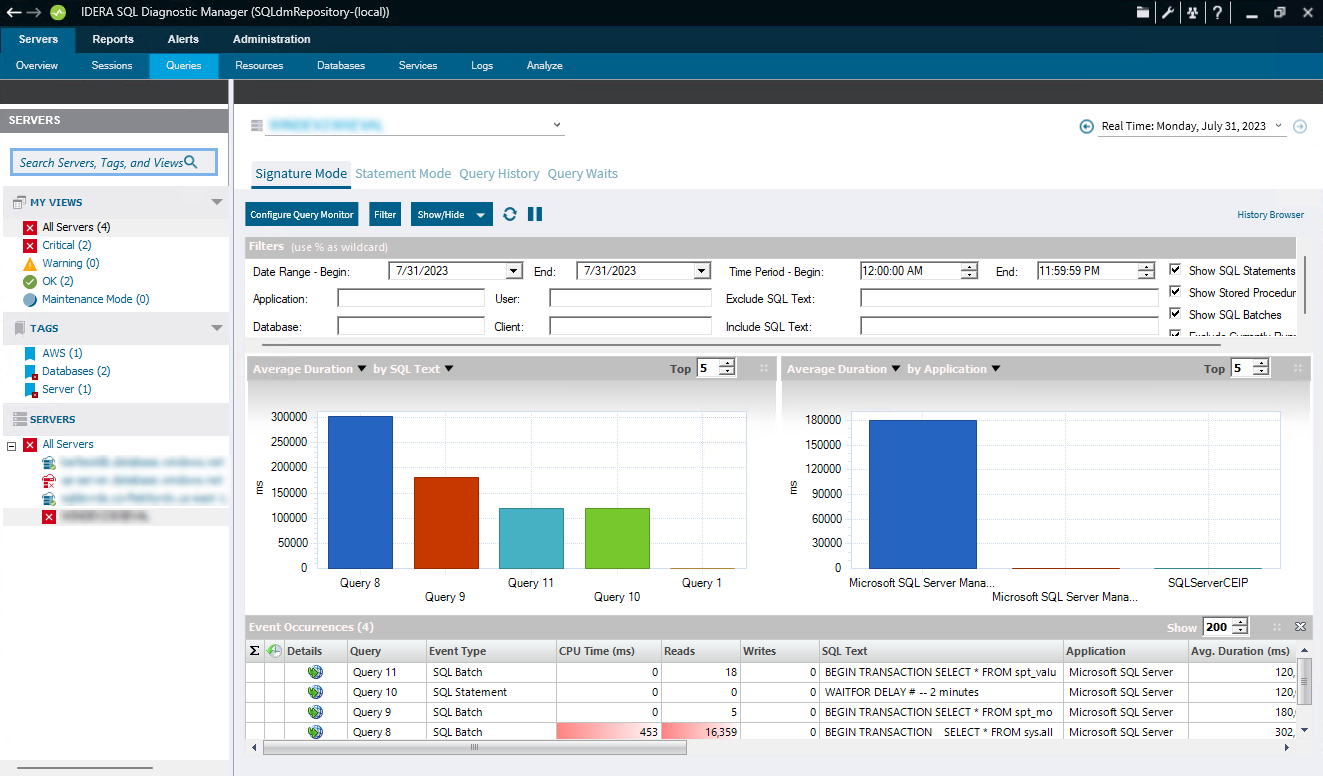
The Query Monitor Signature Mode view includes all active query information, automatically reduced to the signatures and grouped accordingly. Note that the parameters are stripped.

If you want to prevent certain queries from appearing on the Query Monitor views, click Configure Query Monitor > Advanced and enter the applications, databases, or SQL text you want to exclude from the Query Monitor collection. You can also configure these options directly in the SQL Diagnostic Manager web console. |
The Query Monitor Signature Mode view is the place to start when investigating query performance. It broadly defines queries and trends with a less overwhelming amount of data and allows you to diagnose a query in a general sense. Once you identify a potential problem, you may want to view the statement mode view to see why a query is experiencing performance problems for a particular user, and then to the query history to see how the query performs over time and the associated trends.
The Signature Mode view is displayed as follows:
In the Event Occurrences, each listed query has the option to view the Query Details, click to open the Query Details window (if the icon
 is not colored, it means that there is no plan collected).
The Sigma character indicates that the data in this row is at least partially composed of aggregated data. This means that the data is condensed into a day-length summary and some precision about the individual statements, client computers, and users is suppressed. Rows in this view with the Sigma character may include a mix of aggregated and non-aggregated data. |
In the Signature Mode view, right-click any of the listed queries under the Event Occurrences list and click Show Query Text to open the SQL Text window (In this window run a Query Diagnosis and receive a list of performance recommendations). |
Red in the column indicates that the data in that row represents 20% or more of the total data displayed in the list, while yellow indicates that the data in the row represents 5% or more of the total data displayed in the list. |
|