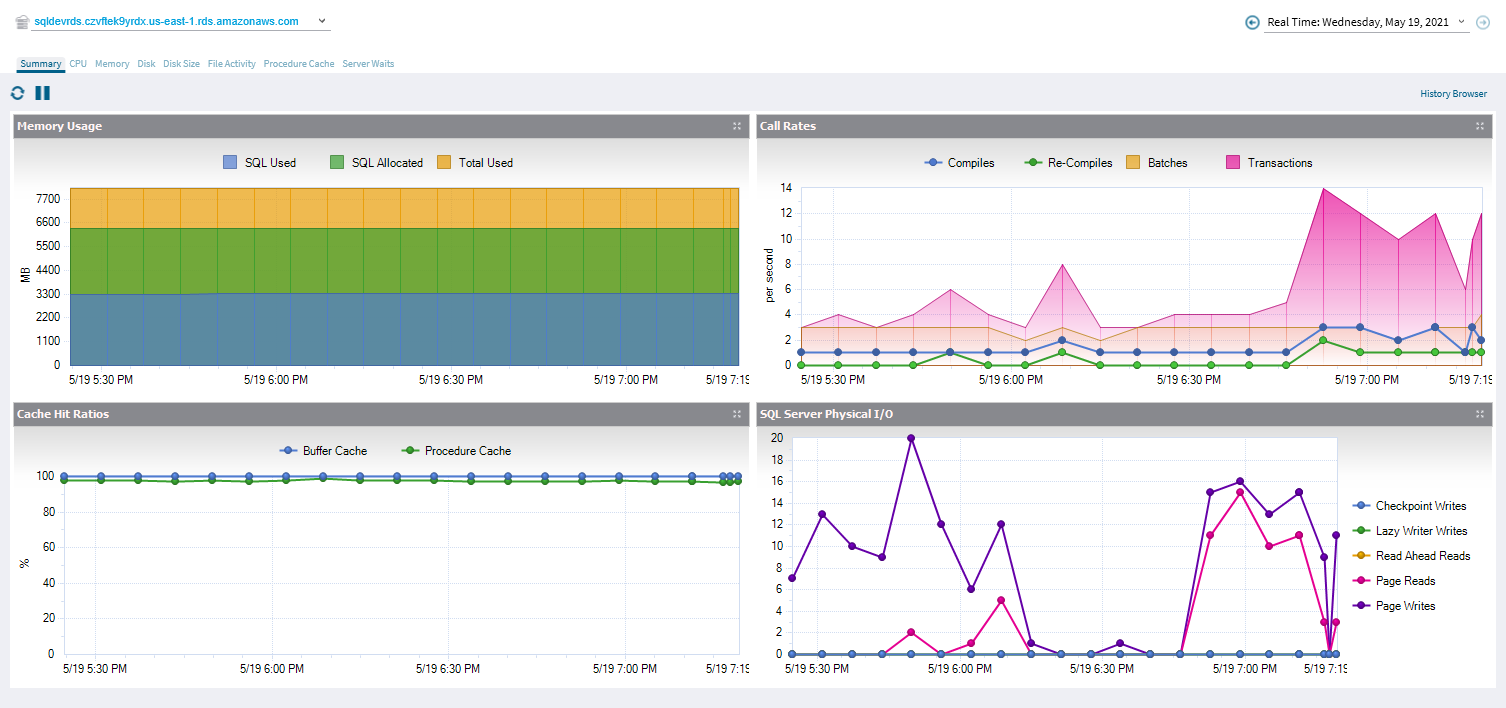
The Resources tab allows you to monitor the system resources on the server hosting the Amazon RDS instance.
The Resources Summary tab displays real-time charts allowing you to quickly identify key diagnostic statistics for monitoring the resources for the selected Amazon RDS instance.

The Call Rates chart displays the rate of batch statements, the compiles into procedure cache, then recompile of statements stored in the procedure cache.
In addition, the Max Worker Percent chart shows the percentage of worker threads used on the database, relative to the maximum available for the service tier.
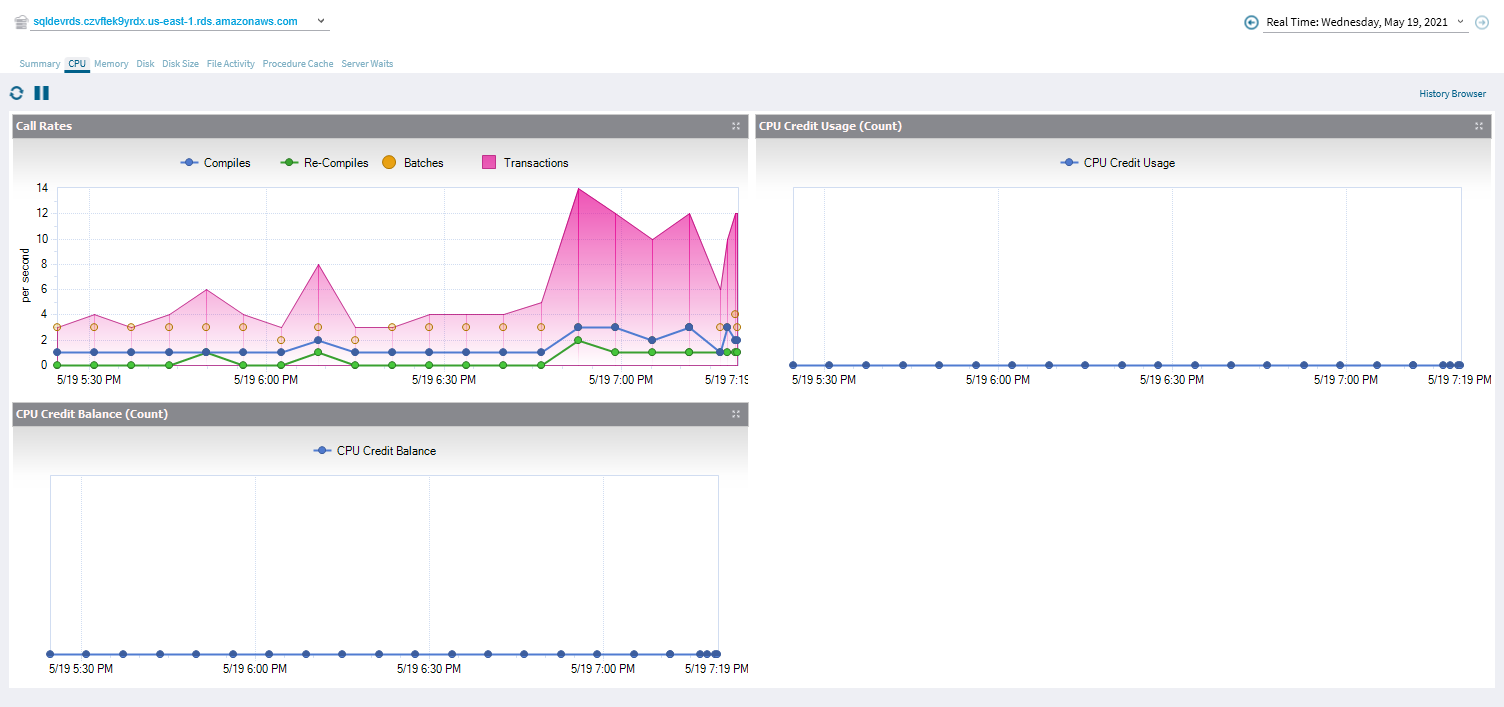
The following charts are available on the Memory tab:
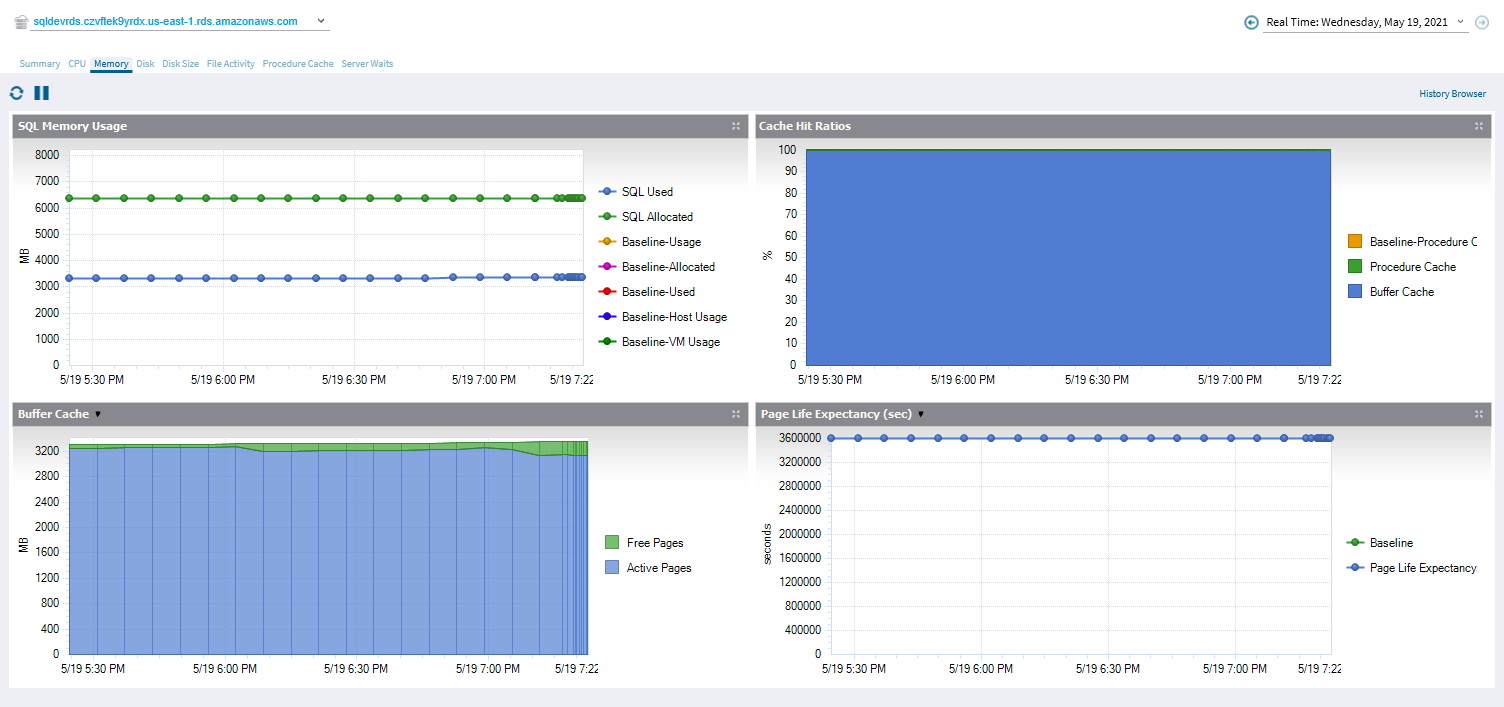
The Disk tab shows the key statistics on the way your disks are used on your Amazon RDS server.
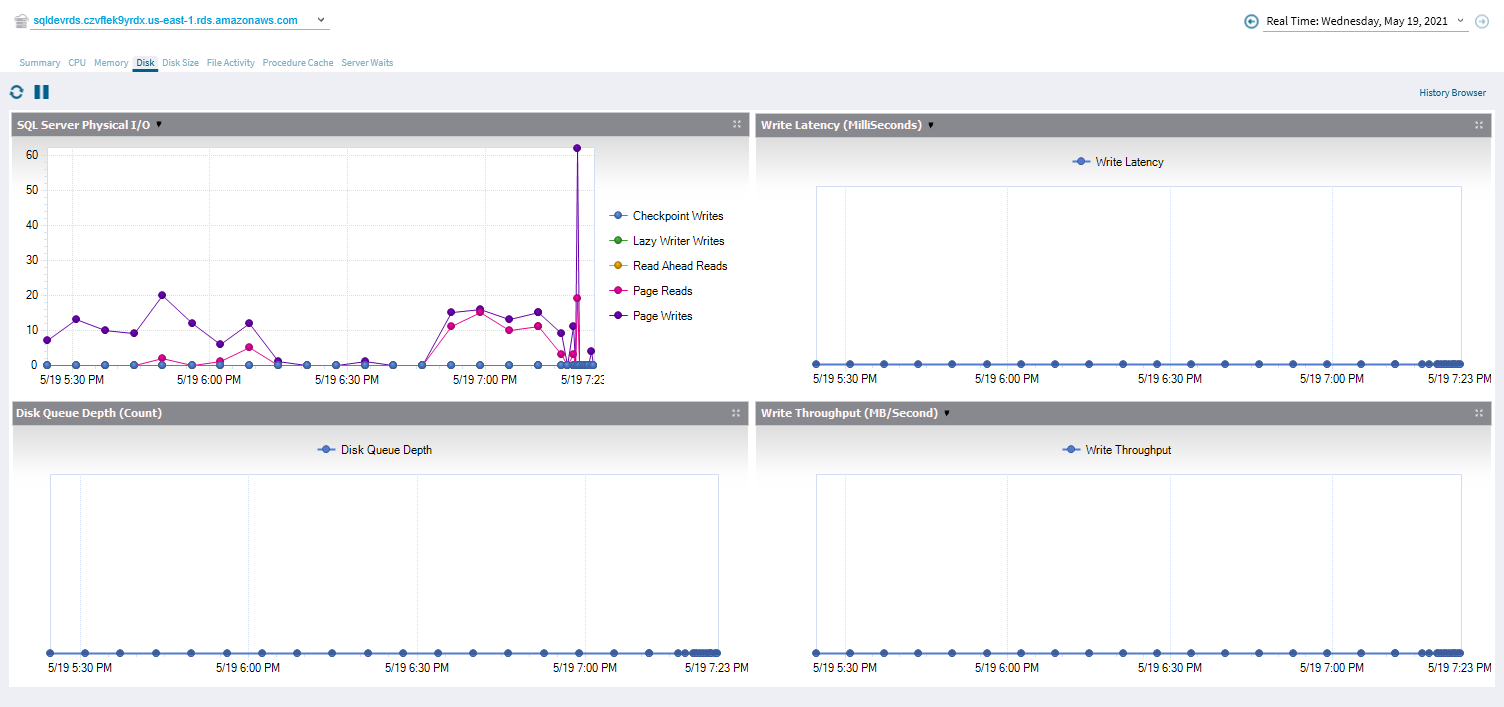
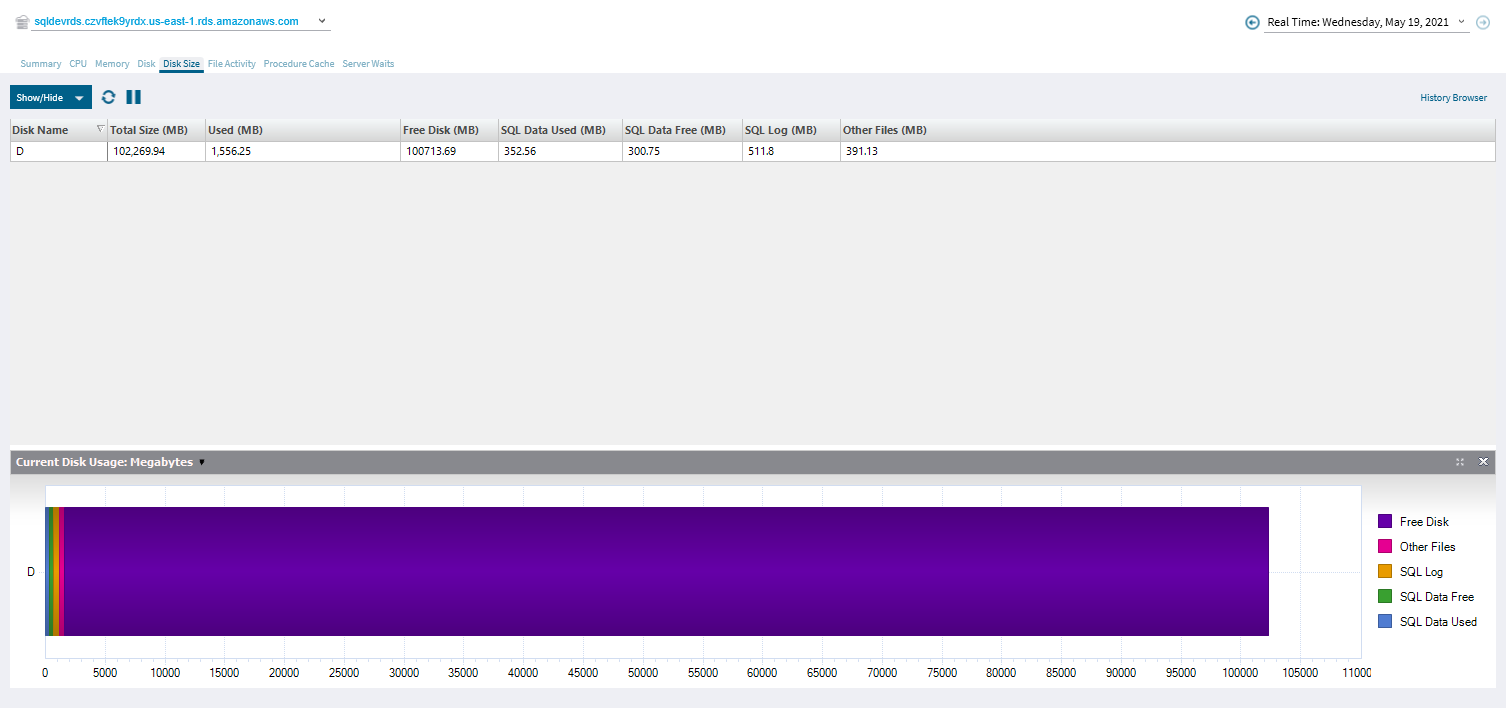
The Disk Size tab allows you to view key statistics on the way your disks are used on the computer hosting your Amazon RDS instance. This allows you to analyze your disk performance for any performance bottlenecks that may be occurring.
The SQL Diagnostic Manager File Activity allows you to view your database files' relative activity on a file-by-file basis.
Each database file is listed in a column that represents the disk or mount point on which the files reside. At the top of each column the overall Reads, Writes, and Transfers per second are listed. Click an individual file to expand it to view its graph and activity data.
The SQL Diagnostic Manager File Activity allows you to view your database files' relative activity on a file-by-file basis. Each database file is listed in a column that represents the disk or mount point on which the files reside. At the top of each column the overall Reads, Writes, and Transfers per second are listed. Click an individual file to expand it and view a graph and the activity data specific to that file.
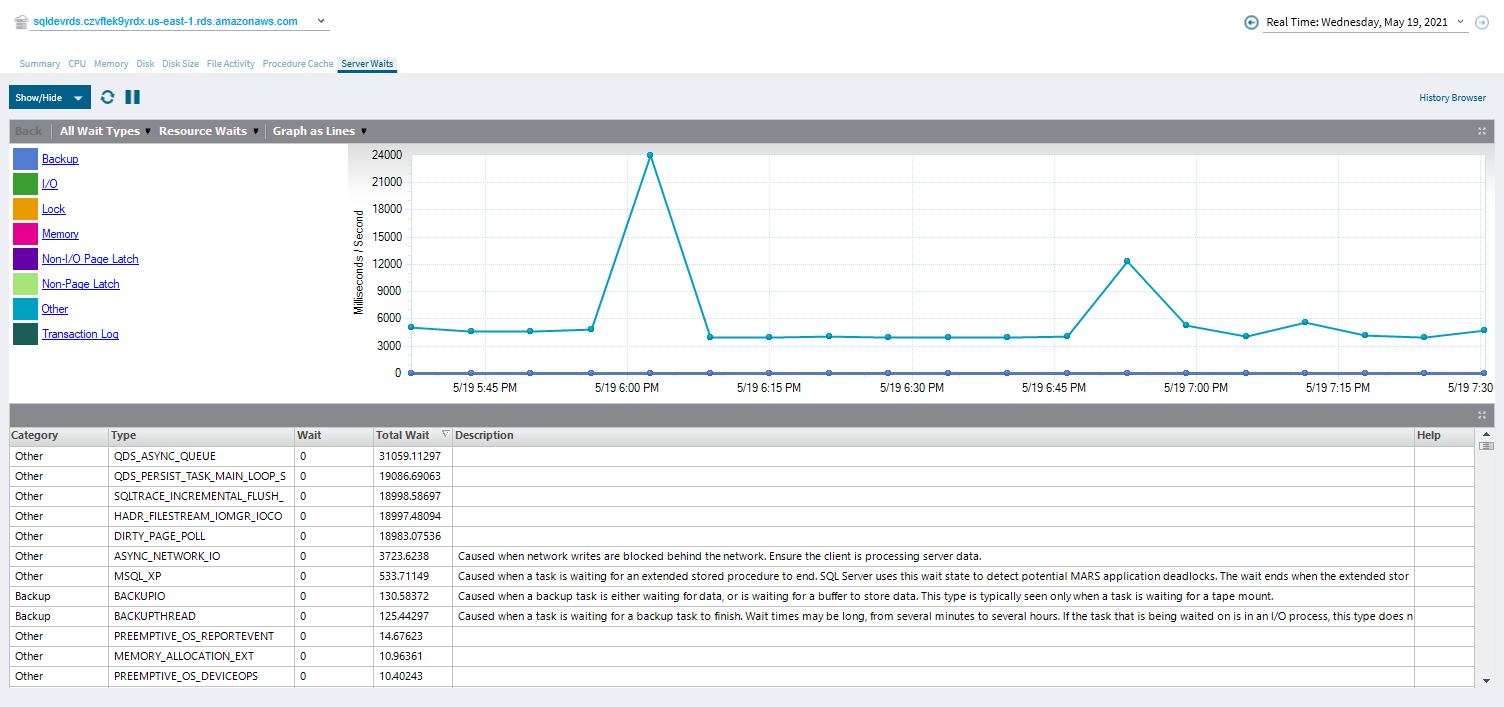
The Server Waits view allows you to see all of the waits affecting Amazon RDS server performance.
|