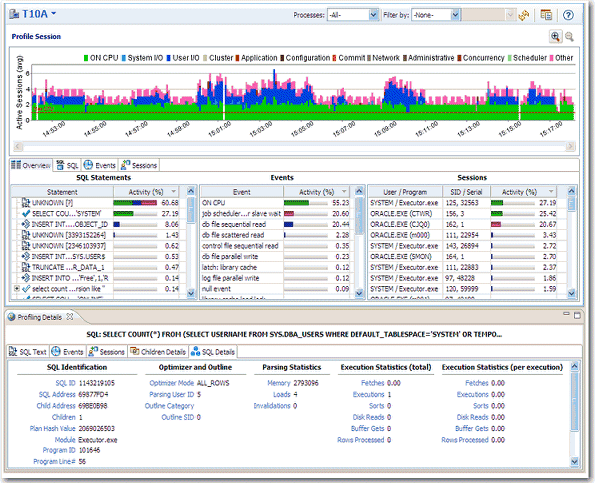
The profiling interface is divided into three major parts:

The graphical portion of the profiling editor presents the distribution of sessions executed over the length of the profiling process, and those that were waiting in DBMS-specific events. It provides a first and most important step in identifying problem areas. Results can be viewed in real-time.
The Load Graph and Top Activity Section compose one view in the editor, while the Profiling Details view is a separate interface component that only activates when an item in the Top Activity Section is specified.
Use a 1280 x 1024 monitor resolution when viewing profiling information. Smaller resolution sizes can obscure details in the view. |
|