The Sessions Summary view displays real-time charts that allow you to quickly view key diagnostic statistics for sessions on your SQL Server instance. The Sessions Summary tab includes the Response Time, Sessions, Lock Statistics, and Blocked Sessions charts.
Access the Summary view
You can open the Summary view of the SQLDM Sessions tab by selecting the appropriate SQL Server instance and clicking Sessions > Summary.
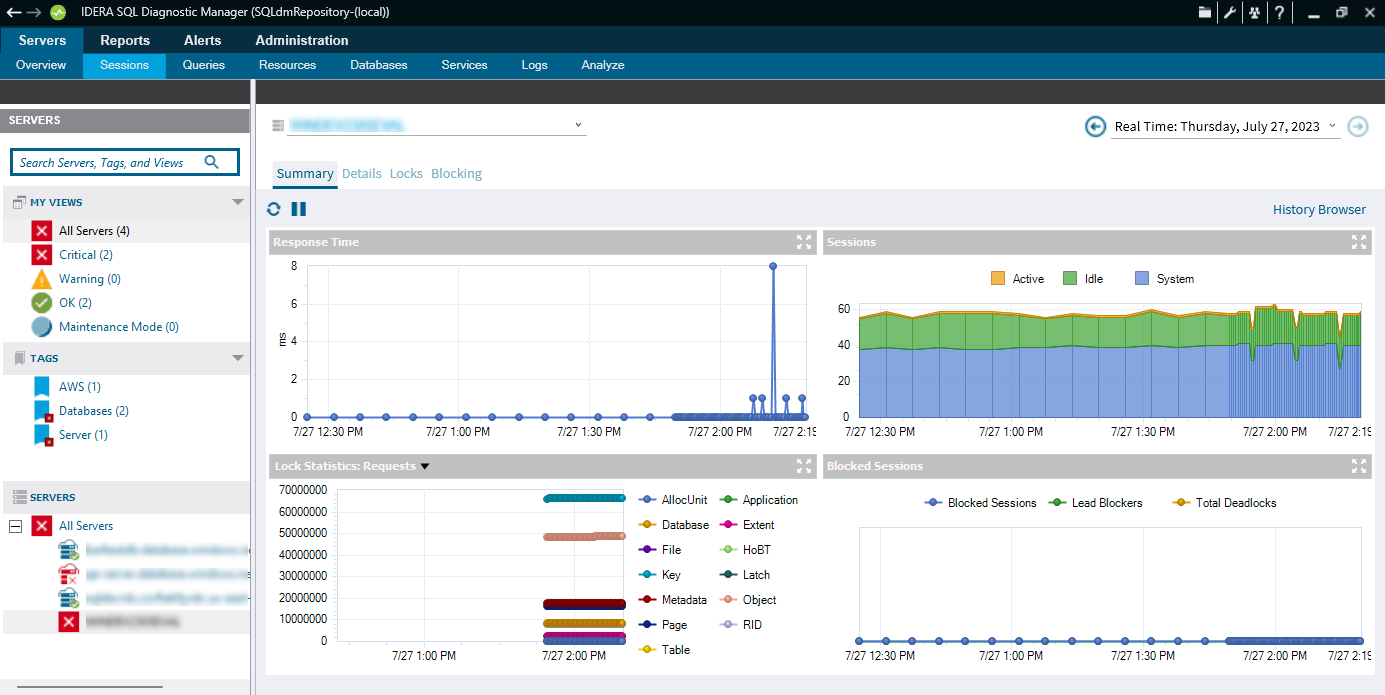
Response Time chart
The Response Time chart displays the response time (in milliseconds), you can see the specific time and response time of any data point in the chart by hovering your mouse over it. The Response Time chart indicates the current speed and congestion of the network as well as the speed with which the SQL Server processes small queries. Unusually high response times could indicate the need to upgrade server or network hardware.
Sessions chart
The Sessions chart displays the number of concurrent connections to the monitored SQL Server instance over time. The total number of sessions includes the Active, Idle, and System sessions. Also, you can see the specific metric value for a given time by hovering your mouse over the chart.
Lock Statistics chart
The Lock Statistics chart provides a breakdown of the various lock types taken by SQL Server in the last refresh. The Lock Statistics chart offers, by using the drop-down menu, charts that include information on the Average Wait Time, Deadlocks, Requests, Timeouts, Waits, and Wait Time. Also, you can see the specific time and statistic on any data point on the Lock Statistics for a given time by hovering your mouse over the chart.
Blocked Sessions chart
The Blocked Sessions charts list all the Blocked Sessions, Lead Blockers, and the Total Deadlocks, in real-time, for the selected SQL Server instance, allowing you to easily see blocks as they occur. Also, you can see the specific time and number of blocked sessions at a given time by hovering your mouse over the chart.
Right-click any of the Summary Sessions graphs to enable the Toolbar option. This toolbar helps you set different configurations, like copying the graph to a clipboard, changing the type of graph, or the color palettes, and printing. Change the view of the graph to 3D/2D, rotate the view, rotate around the Y-axis, rotate around the X-axis, cluster the Z-axis, change the axis settings, and add point labels, a data grid, or a legend box. Also, you can access other graph Properties.