The Statement Mode view includes queries that are presented exactly as they are collected by the Query Monitor Trace.
If queries appear on the Query Monitor views that you never want to appear, click Configure Query Monitor > Advanced and enter the applications, databases, or SQL text you want to exclude from the Query Monitor collection.
The Statement Mode view is where you go to drill down into a specific execution of a particular query. Whereas the signature mode view provides a filtered look at your queries, the Statement Mode view provides all the details you may need to diagnose a specific problem with a query. Once you find the problem query, History mode allows you to track the query over time and view trends.
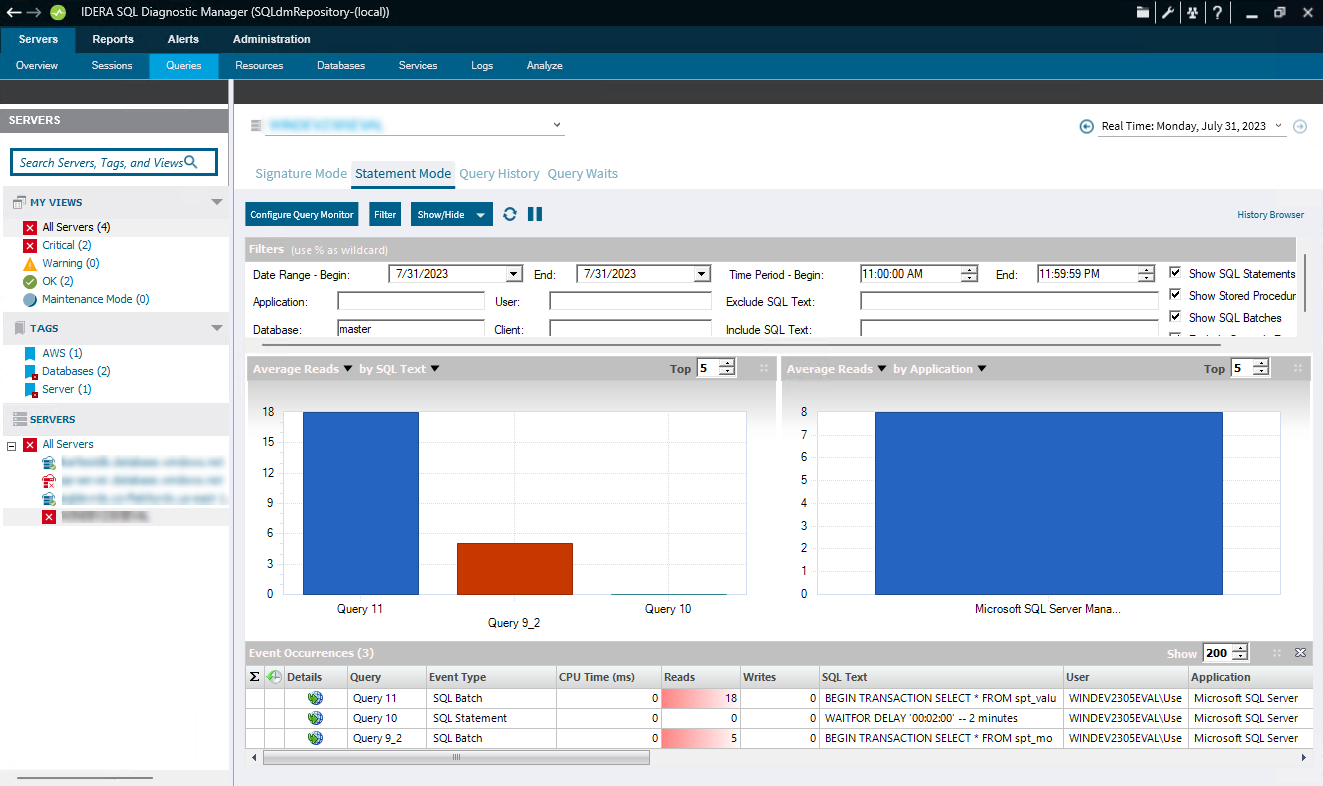
The Statement Mode view is displayed as follows:
- Filter - Use Query filters to narrow the results to only those that most interest you. Do this by selecting the Date Range - Being and End, Application, User, Database, Client, and the SQL Text you want to include or exclude from your results.
- Charts - The primary focus of the Statement Mode view is in the charts. The charts type drop-down allows you to pick a chart type to display: Average Duration, Average CPU, Average Reads, Average Writes, Average Waits, Deadlocks, Blocking, CPU Per Second, and I/O Per Second. Also, you can choose to view the type of charts by the following categories: By SQL Text, By Application, By Database, By User, and By Client.
- Event Occurrences - It lists each occurrence of the query and associated statistics, such as the Event Type, CPU Time (ms), Reads, Writes, SQL Text, User, Application, Duration (ms), Database, Avg. CPU Time (ms), Avg. Writes, Avg. I/O per sec, Wait Time (ms), Avg. CPU Per Sec, Avg. Reads, Start Time, End Time, Blocking Time (ms), Deadlocks, Client, and Speed.
In the Event Occurrences, each listed query has the option to view the Query Details, click![]() to open the Query Details window (if the icon
to open the Query Details window (if the icon![]() is not colored, it means that there is no plan collected).
is not colored, it means that there is no plan collected).
Sigma (Σ) character
The Sigma character indicates that the data in this row is at least partially composed of aggregated data. This means that the data is condensed into a day-length summary and some precision about the individual statements, client computers, and users is suppressed. Rows in this view with the Sigma character may include a mix of aggregated and non-aggregated data.
In the Signature Mode view, right-click any of the listed queries under the Event Occurrences list and click Show Query Text to open the SQL Text window (In this window run a Query Diagnosis and receive a list of performance recommendations).
Understanding cell colors
Red in the column indicates that the data in that row represents 20% or more of the total data displayed in the list, while yellow indicates that the data in the row represents 5% or more of the total data displayed in the list.