The Database Summary tab allows you to view the status of all the databases on the selected SQL Server instance. Along with the database status table, the Summary tab includes charts that provide options for viewing the capacity usage and recent trends of your databases. You can select multiple databases in the list using click+Shift and click+Ctrl to compare several databases.
The status column can help you quickly identify databases that have associated alerts and need your Attention.
The Database Summary tab lists each database on the monitored SQL Server instance. The Database Summary tab displays a large variety of database statistics and is an important way to get an overview of the health of your databases. This information gives you a good indication as to how the data is configured in your database, such as comparing the volume of your table data compared to your indexes, or the size of your log files.
Access the Database Summary view
You can open the Summary view of the SQL Diagnostic Manager Databases tab, select the appropriate SQL Server instance, click Databases, and select Summary .
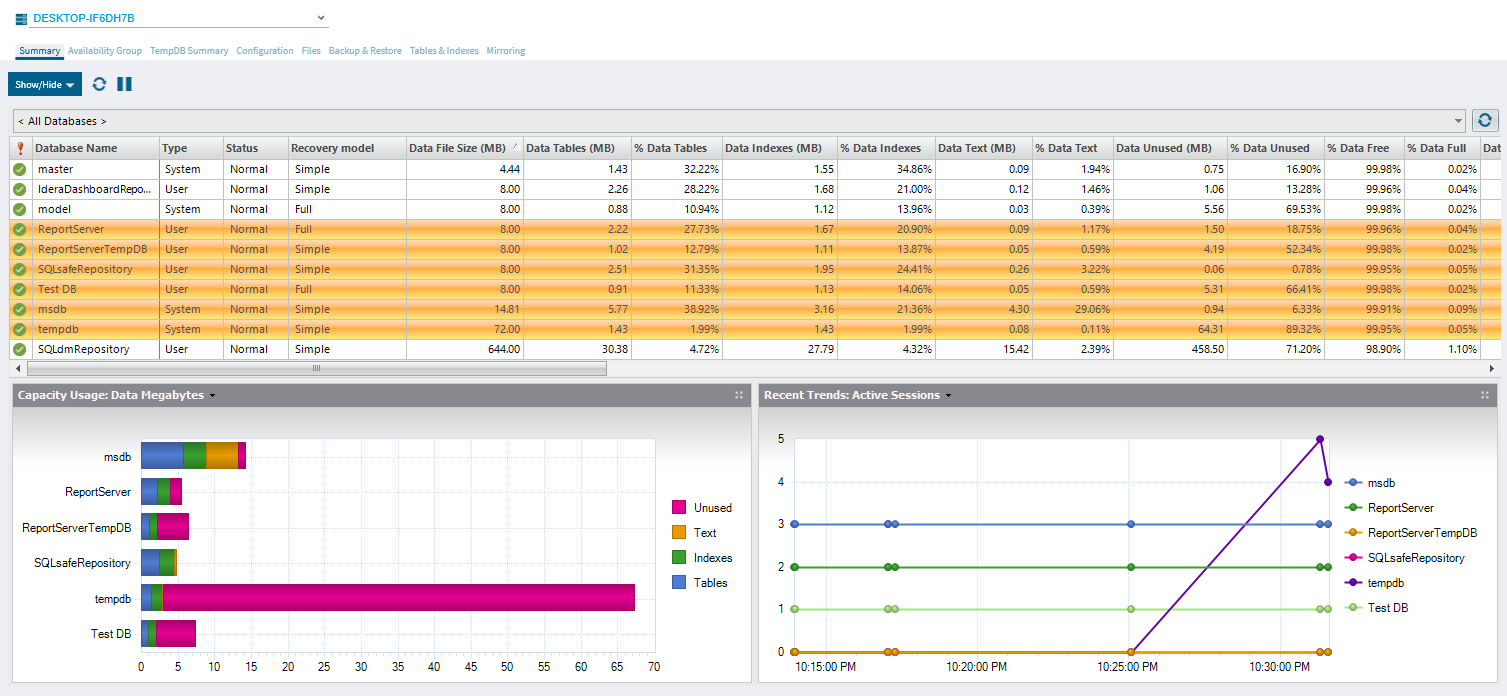
Database Summary tab charts
The Database Summary tab includes charts that display capacity usage and recent trends information for your database.
Capacity Usage
You can choose to view how data or the log is used on your database. The drop-down list allows you to choose to view the data or log in megabytes or percentages. For more information, click inside the chart to open the Database Files tab.
Recent Trends
You can choose to view how your database or group of databases are used currently by selecting either active sessions, transactions per second, data size, log size, or log flushes from the drop-down list.