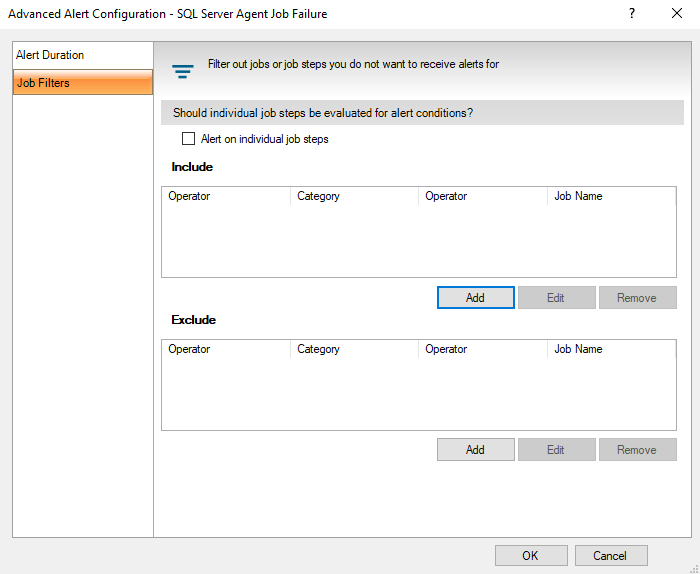
The Alert Filters tab of the Advanced Alert Configuration window allows you to select jobs or job categories to include or exclude from alerting for the specified metric. Filtering allows you to limit the amount of alert noise generated for SQL Server Agent Jobs or Job categories that, for example, are known to run for a long time.
By default, SQL Diagnostic Manager alerts on all Jobs. If you check the Alert on individual job steps box, all job steps generate alerts. Using the Include filter limits job alerts to only those SQL Server Agent Job steps that apply to the filter. The Exclude filter limits the job alerts to every SQL Server Agent Job step except for those included in the Exclude filter.
The metrics that allow for SQL Server Agent Job exclusions include the following:
- SQL Server Agent Job Completion
- SQL Server Agent Job Failure
- SQL Server Agent Long Running Job (Minutes)
- SQL Server Agent Long Running Job (Percent)
To filter SQL Server Agent Job alerts:
- Open the Alert Configuration window and select the alert you want to configure.
- Click Advanced.
- Select the Job Filters tab.
- Check the Alert on individual job steps box if you would like an alert for each step in each job.
- Click the Add button under the Include or Exclude filters.
- Enter the Job Name or Job Categories to include or exclude and click OK. Use the percent symbol (%) as a wildcard.
- Click OK to apply your changes.
You can set thresholds for the SQL Server Agent Long Running Job (Minutes) and SQL Server Agent Long Running Job (Percent) metrics on your SQL Server instance.
To add a job for specific alert configuration:
- Right-click a SQL Server instance in the Servers sidebar.
- Select Configure Alerts.
- Select the job-specific metric you want to edit from the list in the Alert Configuration window.
- On the Configuration tab, click Add.
- Specify or select the job name.
- Make the appropriate changes to your alert configuration for this job, and click OK. SQL Diagnostic Manager now displays the job in the list on the Configuration tab.
Follow these steps to edit the alert threshold configuration for a job:
- Right-click a SQL Server instance in the Servers sidebar.
- Select Configure Alerts.
- Select the job-specific metric you want to edit from the list in the Alert Configuration window.
- On the Configuration tab, select the job you want to configure, and click Edit.
- Change the alerts thresholds by moving the arrows to the appropriate level or by entering new values of the threshold level on the Job Threshold Configuration window.
- Click OK.