The Top Activity section is located in the middle section of the editor and displays where the load originates. Specifically, the top SQL statements, top events that the database spends time in, as well as the top activity sessions.
The Top Activity section is composed of a series of tabs that provide detailed statistics on individual SQL statements and sessions that were waiting or executing over the length of a profiling session.
- The top SQL tab provides more detailed information than provided on the Overview tab, in terms of executing SQL statements and procedures. For more information, see Top SQL Tab.
- The top ExecutionActivity (DB 2 Specific) tab provides details about the statements and procedures that ran. This is DB 2 specific. For more information, see Top Execution Activity Tab (DB2 Specific).
- The top Events tab displays information about wait events profiled by the execution process. For more information, see Top Events Tab.
- The top Sessions tab displays information about sessions profiled by the execution process. For more information, see Top Sessions Tab.
- The top Blockers tab (Oracle) displays information about blocking sessions. For more information, see Top Blockers Tab (Oracle Specific).
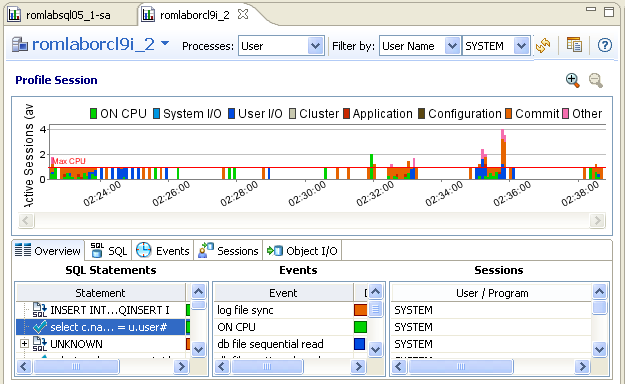
- The top ObjectI/O tab (Oracle-Specific) tab does not appear in the Top Activity Section unless the data source being profiled is an Oracle platform. This tab displays information about the I/O profiled by the execution process. For more information, see Top Object I/O Tab (Oracle-Specific).
- The top Procedures tab (Oracle, SQL Server, and Sybase-specific) displays information about procedures observed during profiling. For more information, see Top Procedures Tab (Oracle, SQL Server, and Sybase Specific).
When you select any item from the Top Activity tabs, details are displayed in the Profiling Details view. The tabs that appear in Profiling Details will be different depending on the database platform and whether you selected a statement, session, or an event. This is to accommodate the parameter specifics of the item you selected.
Top SQL tab
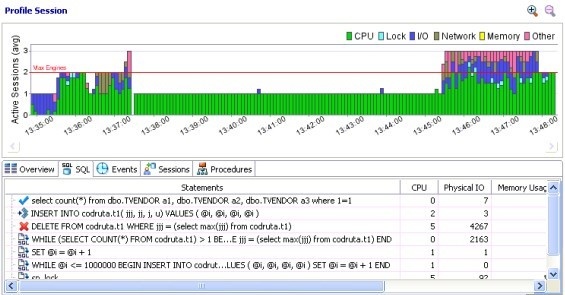
The Profile editor's SQL tab shows a representation of all SQL statements that are executing or waiting to execute over the length of the profiling session or within the currently selected graph bars.
The image below depicts results achieved for a Sybase database. The columns displayed on this tab differ depending on the database platform.
Statements
Statements can be grouped by type by right-clicking the view and selecting Organize > By Type.
Statements are grouped when they differ only by their clause values. This enables the roll-up of SQL statements that only differ by a variable value. For example: select * from emp where empno=1; and select * from emp where empno=2. A '+' symbol appears beside rollup statements. You can click the symbol to expand and view the different statement predicates.
Additionally, the SQL tab displays two other groupings of statements:
| Group | Description |
|---|---|
| OTHER | Includes all recognized statements other than INSERT, SELECT, UPDATE, DELETE, and MERGE statements. |
| UNKNOWN | Statements that are not recognized by the application. SQL Query Tuner has been improved to query the caching more often and more intelligently so that UNKNOWN appears less frequently in the Top SQL tab. The system queries the data source for SQL text in 15 second intervals. Unknown may still appear infrequently as the SQL text may have been removed by the database. |
All statements are displayed in a tree structure with the following statement components:
| Statement Component | Description |
|---|---|
| Subject | The DML statement type (and FROM clause, as appropriate). |
| Predicate | The WHERE clause. |
| Remainder | Any statement component following the WHERE clause. |
For example, all statements with common subjects are shown as a single entry with multiple children; one child for each unique predicate. Predicates are similarly broken down by remainders.
Right-clicking the SQL tab and selecting Organize By lets you choose between Statement Type grouping and None. The None option disables grouping by statement.
Statistics
Statistics are provided for statements and statement components. The statistics let you evaluate costs and spot wait event problems not just at the level of entire SQL statements, but also at the level of statement components. For each subject, predicate or remainder entry, the following statistics are provided:
Columns displayed on the top SQL tab differ depending on the data source platform.
| Statistic | Shown for Platform | Notes |
|---|---|---|
| Exeutions | SQL Server, Oracle, Sybase, DB2 | The number of active executions for the statement or statement component over the length of the profiling session or the selected graph bars. |
| Avg. Elapsed (sec) | Oracle, DB2 | The average amount of time that elapsed while executing the statement during the profiling period. This column appears for only SQL Server, DB2 and Oracle data sources. |
| DB Activity (%) | SQL Server, Oracle, Sybase, DB2 | A graphical representation of the distribution of execution and wait time for the statement or statement component. |
| SQL ID | Oracle | The ID value of the SQL statement. This statistic only appears on Oracle data sources. |
| Child Number | Oracle | The child number in the database. This statistic only appears on Oracle data sources. |
| Parsing User ID | Oracle | The ID of the user who parsed the statement. This statist only appears on Oracle data sources. |
| Plan Hash Value | Oracle | The execution value of the statement. This statistic only appears on Oracle data sources. |
Top Execution Activity tab (DB2 specific)
In addition to the statistics displayed on the Top SQL tab, DB2 platforms have an additional tab in the Profile Session editor named Execution Activity, which contains the following statistical rows: Rows Read, Rows Written, Fetch Count, Statement Sorts, Sort Time, and Sort Overflows.
Top Events tab
The Top Events tab displays information about wait events on the resources involved in the profiling process. This display is used to tune at the application or database configuration level. For example, if the top events are locks, then application logic needs to be examined. If top events are related to database configuration, then database setup should be investigated.
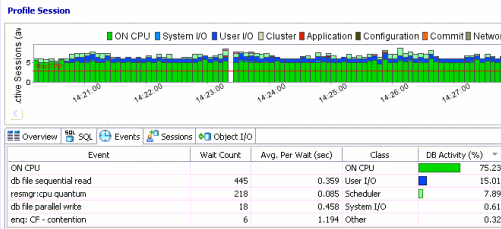
The columns that display are data source-dependent. For example, the Wait Count and Avg. Per Wait (sec) columns display only for an Oracle data source.
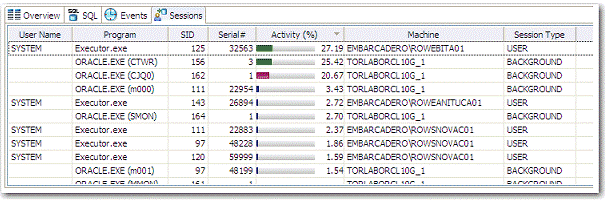
Top Sessions tab
The Sessions tab provides information about individual sessions. This tab provides information about sessions that are very active or bottlenecked.
Top Blockers tab (Oracle Specific)
The Blockers tab provides details on sessions holding blocking locks.
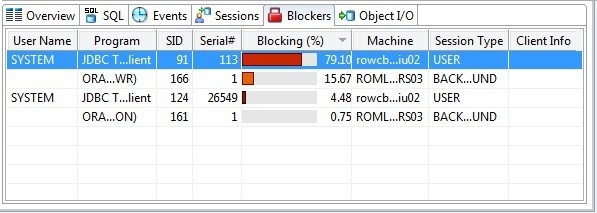
The following parameters are displayed on the Blockers tab:
| Value | Description |
|---|---|
| User Name | The user name under which the session was run. |
| Program | The name of the executable under which the session was run. |
| SID | The SID value of the session. |
| Serial | The serial number of the machine from which the session executed. |
| Blocking (%) | A graphical representation of the percentage of total blocked sessions being blocked by a blocking session. |
| Machine | The machine name and network location of the machine from which the session executed. |
| Session Type | The type of session. |
| Client Info | The name/type of the client from which the session initiated. |
For more detailed information, see Viewing Details on the Blockers Tab (Oracle).
Top Object I/O tab (Oracle specific)
The Object I/O Tab is specific to the Oracle data source platform, and displays information about Oracle I/O loads on the profiled data source.
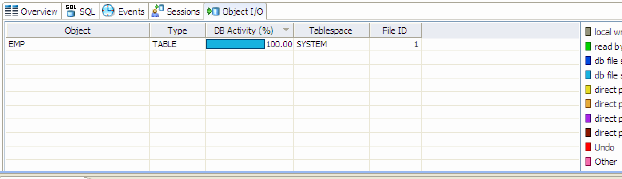
The following parameters are displayed on the I/O tab:
| Value | Description |
|---|---|
| Object | The name of the data source object affecting the Oracle I/O. |
| Type | The object type. For example, table, partition, or index. |
| DB Activity (%) | Use the color chart on the right-hand side of the I/O tab to view the I/O load on the data source during the profiling session. |
| Tablespace | The name of the tablespace where the object resides. |
| File ID | The unique ID value of the file from where specified object resides. |
Top Procedures tab (Oracle, SQL Server, and Sybase specific)
The Procedures tab is specific to Oracle, SQL Server, and Sybase data source platforms. It displays information about Procedure loads on the profiled data source.
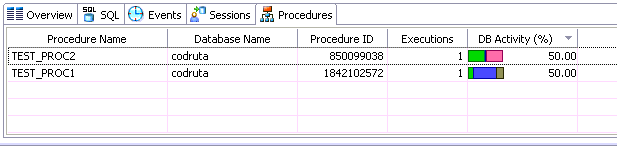
The following parameters are displayed on the Procedures tab:
| Value | Description |
|---|---|
| Procedure Name | The name of the procedure affecting the database performance. |
| Database Name (SQL Server, Sybase only) | The name of the database where the procedure resides. |
| Oracle (Oracle only) | The owner of the schema in which the procedure resides. |
| Procedure ID | A unique ID created when the procedure is created. |
| Executions (SQL Server, Sybase only) | The number of times the procedure was executed during the session. |