This section includes the following topics:
About the Dashboard tab
The Precise for Web Dashboard tab provides a comprehensive overview of all instrumented instances, based on the data collected by the Precise for Web agent. The information displayed in this workspace pinpoints performance trends and issues in your Web server and offers clear navigational recommendations throughout for further analysis and handling. See About the Activity workspace and About the Statistics tab.
How the Dashboard tab is structured
The Dashboard tab is divided into three areas: the Main area, the Association area, and the Associated Findings area. The Main area lists all the instances that belong to the Tier. The Association area and Associated Findings area provide more extensive information on the selected instance.
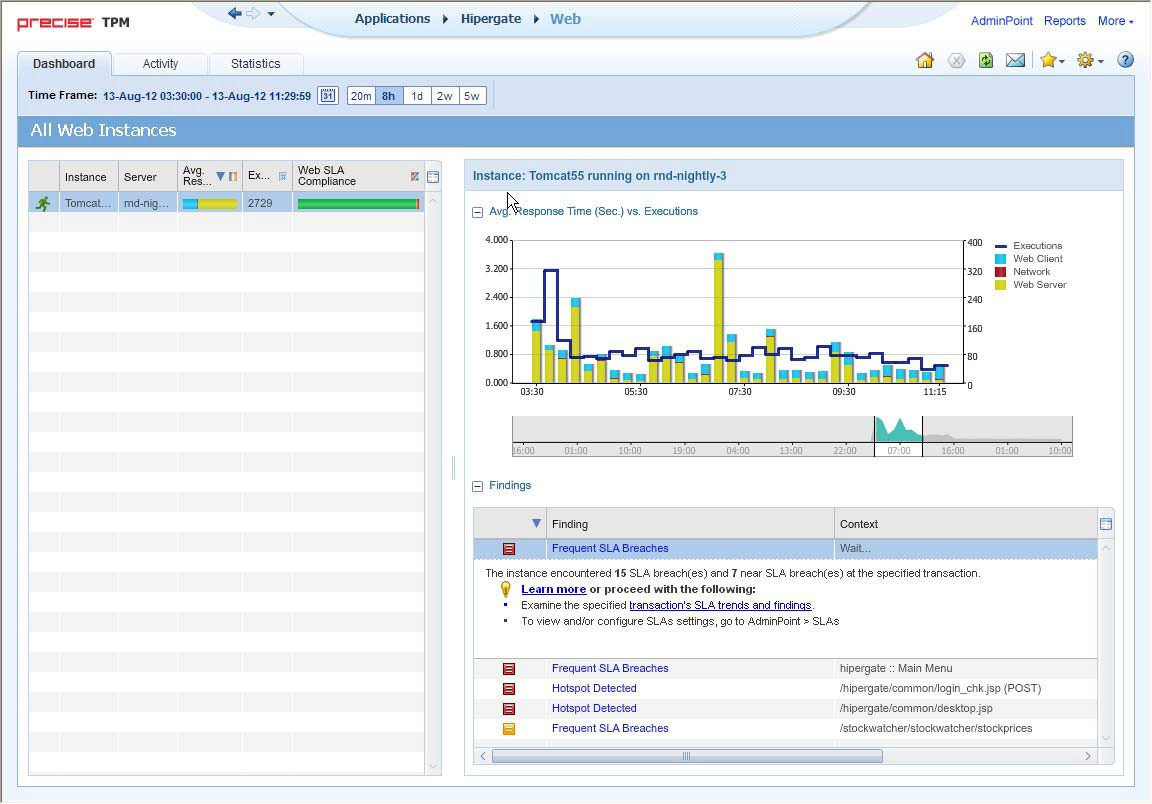
Figure 1 Dashboard tab
About the Main area in the Dashboard tab
The instance table displayed in the Main area lists all the Web instances that are monitored by Precise for Web agents in the selected Tier. Each row corresponds to an instance. The All row in the main instance table summarizes the availability, response time and SLA compliance for all listed Web instances.
The table below describes the information displayed in the Main area when client-side collection (with server-side collection) is configured.
Table 1 Client-side collection (with server-side collection)
| Column | Description |
|---|---|
| Icon | Indicates whether or not the instance is available. A green running figure indicates that the instance is currently available; a red standing figure indicates that the instance is currently unavailable. A graph with a red X indicated that this is an unmonitored instance. |
| Instance | Name of the instance (as configured during the Installation procedure). |
| Server | Name of the server where the instance is installed. |
| Response Time (Avg) | Average response time for all pages. |
| Web SLA Compliance | The Web Service Level Agreement broken down into the following components: SLA Breach, SLA Near-Breach and SLA OK. |
| Executions | Total number of instance pages viewed within the selected time frame. |
About the Association area and Associated Findings area in the Dashboard tab
This area is divided into two sections. The top section shows an overtime graph of the average response time vs. executions. The bottom section shows the findings. Clicking on the hyperlinked finding title or following step of the finding launches, in context, to the related tab from which the data was derived.